


9# Three Line Break MT4
Line Break with slow Half Trend
Trend Following Strategy
Submit by Btrader
The Three Line Break chart, introduced by Steve Nison, is an excellent trend indicator, because it filters the minor movements and highlights the significant ones, and it appears to be one of the most reliable trend-follower indicators so far developed. The type of chart in question is very similar to the Renko chart.
The Three Line Break chart is a chart that is simple to construct, but which can be very useful for identifying the market phase in which you are.
The Three Line Break chart is a chart that is simple to construct, but which can be very useful for identifying the market phase in which you are.
The first box is drawn by drawing a rectangle which has the opening price as a
low base and the closing price as a high base; the color will coincide with the one we have chosen to identify the bullish sessions: in our case green.
The next box will be traced only if a closure is recorded that is higher than the maximum value of the previous box or lower than the minimum value of the previous box: in the first case a new
green box will be drawn, which will extend up to the new closing price; in the second case, a new red box will be drawn, which will extend up to the new closing price.
As you can guess, the Three Line Break chart is completely independent of the time factor.
The name of this type of graphic representation derives from the fact that, according to the classic interpretation, the presence of three consecutive green boxes represent the beginning of a new
uptrend, while the presence of three consecutive red boxes represent the beginning of a new bearish trend.
In this strategy the Three Line break chart is used with the MT4 trend indicator par excellence with slow setting to try to identify only long movements but at the same time trying to have a profitability greater than 50% than for a trend following trading system it means to be profitable, considering that the profit ratio stop loss is at least 1: 1.5.
Metatrader 4 indicators
Three Line Break
Half Trend period 6.
Trading rules
Buy
Three Line Break green rectangle.
Half Trend buy arrow.
Enter the market when the two trends are in agreement.
Sell
Three Line Break green rectangle.
Half Trend buy arrow.
Enter the market when the two trends are in agreement.
Exit position
Place initial stop loss below/above the previous swing high/low.
Profit Target minimum ratio stop loss 1:1.5
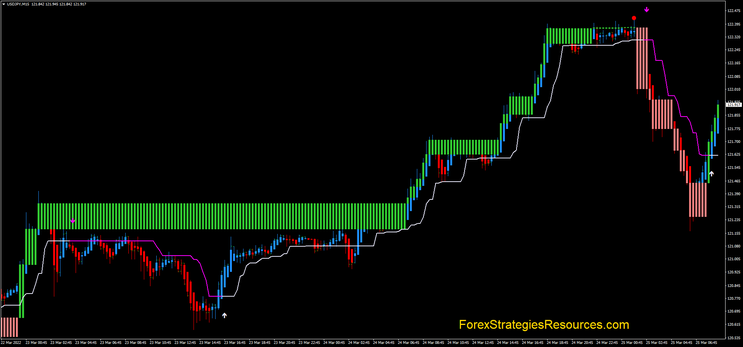
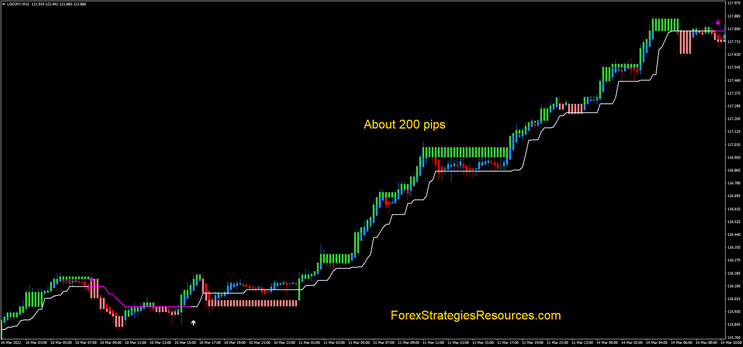
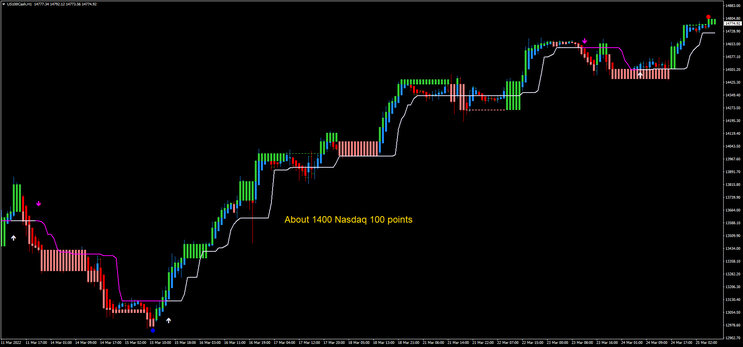
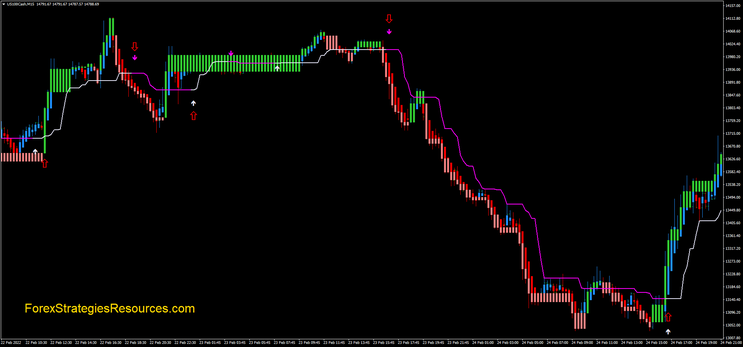
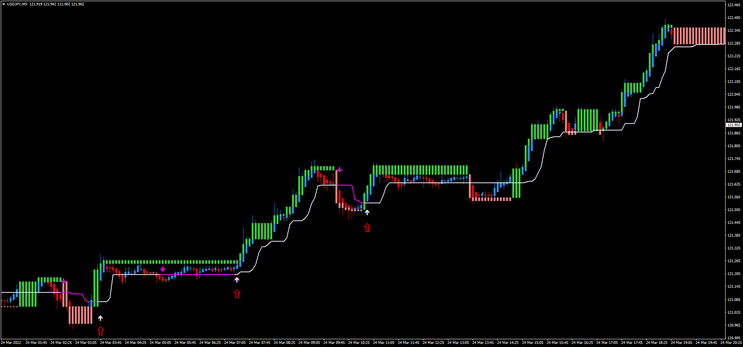
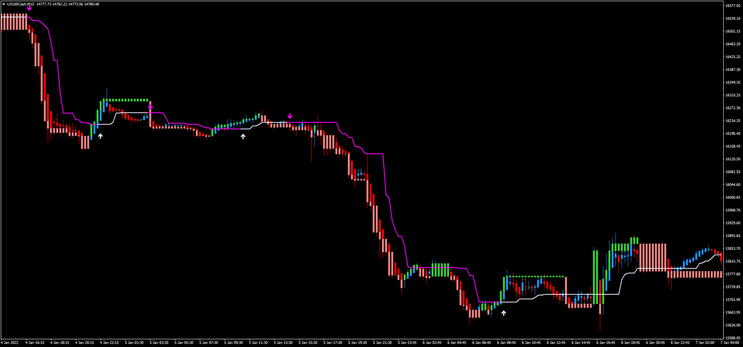
Example of trades.
104# Center of Gravity - Forex Strategies - Forex Resources - Forex
6# Volume Spread Analysis - Forex Strategies - Forex Resources ...
84# Gold Miner - Forex Strategies - Forex Resources - Forex ...
70# Magic - Forex Strategies - Forex Resources - Forex Trading-
32# Dolly Modified - Forex Strategies - Forex Resources - Forex ...
137# Merdekarama - Forex Strategies - Forex Resources - Forex ...
94# Steinz HAS - Forex Strategies - Forex Resources - Forex ...
109# Contrarian - Forex Strategies - Forex Resources - Forex ...
47# Fx-Blood Modified - Forex Strategies - Forex Resources -
133# Bidara - Forex Strategies - Forex Resources - Forex Trading
50# Black King System - Forex Strategies - Forex Resources -
62# Ansatsu Trend Follower System - Forex Strategies - Forex ...
112# Strong System with Fibocal - Forex Strategies - Forex ...
2# 5 Min Blue Trend Rider - Forex Strategies - Forex Resources ...
65# Oracle - Forex Strategies - Forex Resources - Forex Trading ...

Write a comment