


260# Orderblock Reversal Zone Strategy
Orderblock Reversal Zone Strategy ia a trend reversal trading system for MT4.
Indicators (default settings)
-
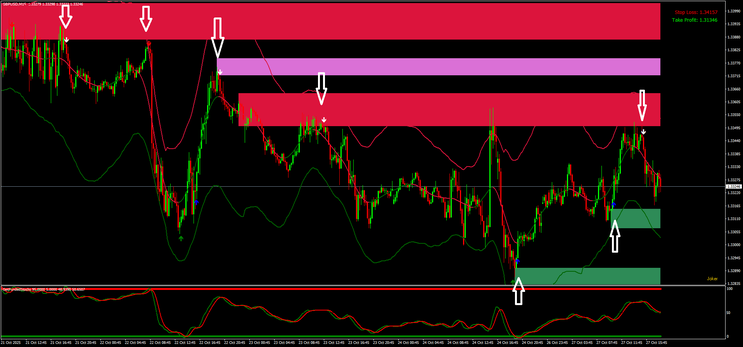
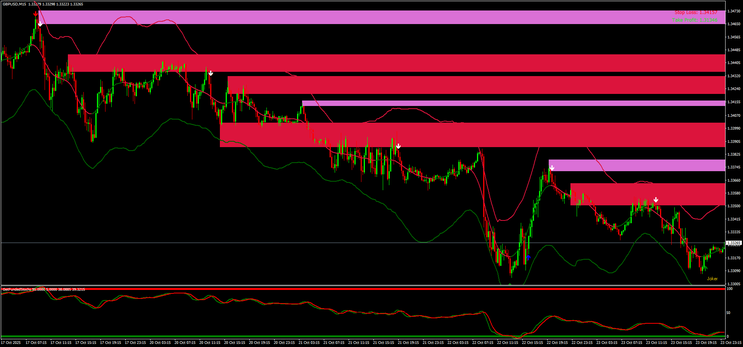
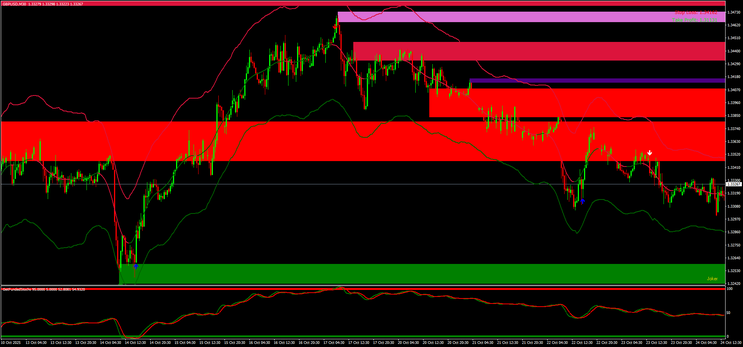
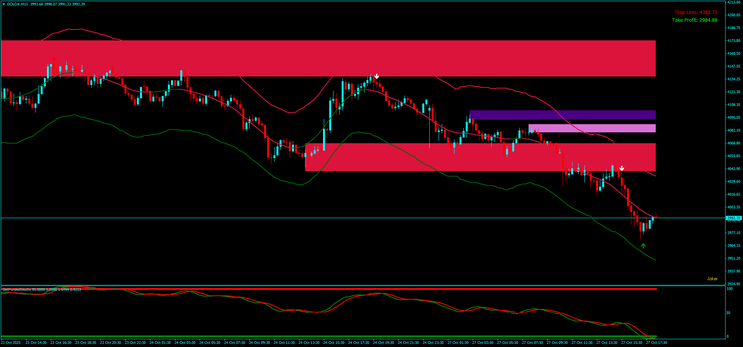
BLOCKS – Marks supply (red zones) and demand (green zones).
-
TMA Centered Bands – Provides dynamic volatility boundaries (similar to Bollinger Bands).
-
Stochs – A stochastic-based momentum oscillator used for entry timing.
Timeframe & Pair
-
Timeframe: M5 (5-minute) or higher.
Pair: any,
Buy
-
Price enters a green demand zone (highlighted by BLOCKS).
-
TMA Bands confirmation:
-
Price touches or goes below the lower TMA band (oversold condition).
-
-
Stochs confirmation:
-
The stochastic lines are below 20 and crossing upward or (bullish crossover).
-
-
Entry:
-
Enter a long position at the first bullish candle close with a blue arrow signal.
-
-
Stop Loss:
-
Just below the green demand zone or below the recent swing low.
-
-
Take Profit:
-
Near the next red supply zone or at the upper TMA band.
-
Sell
-
Price enters a red supply zone (highlighted by BLOCKS).
-
TMA Bands confirmation:
-
Price touches or goes above the upper TMA band (overbought condition).
-
-
GetFundedStochs confirmation:
-
The stochastic lines are above 80 and crossing downward or (bearish crossover).
-
-
Entry:
-
Enter a short position at the first bearish candle close with a white or red arrow signal.
-
-
Stop Loss:
-
Just above the red supply zone or above the recent swing high.
-
-
Take Profit:
-
At the next green demand zone or lower TMA band.
-
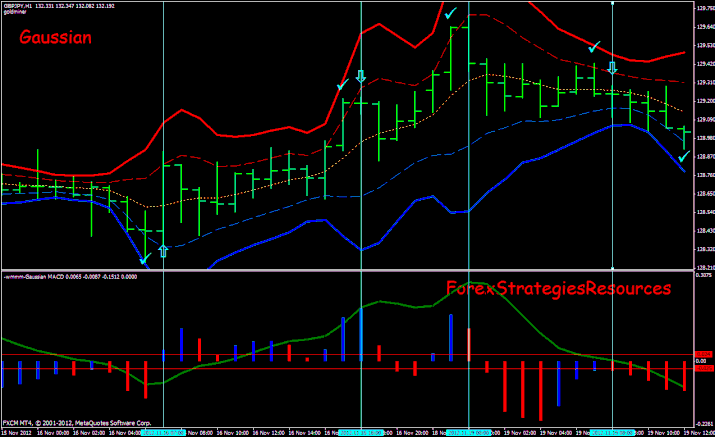
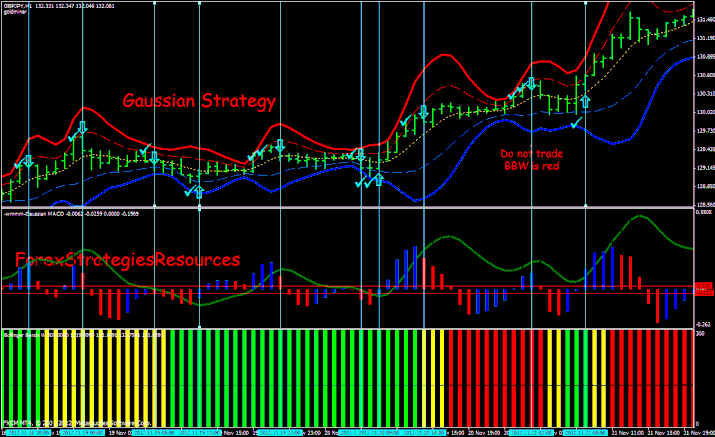
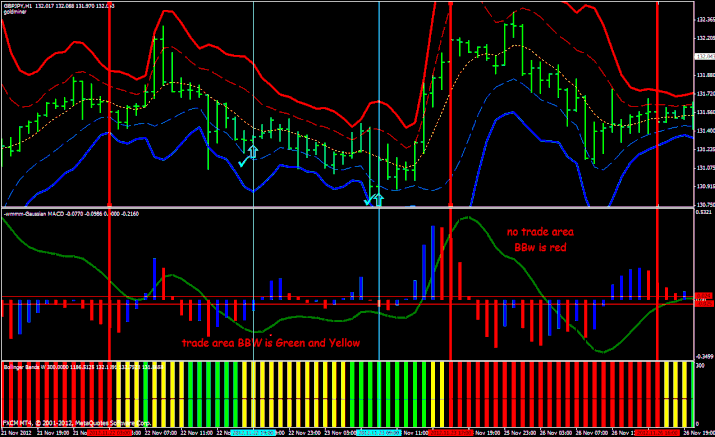
Gaussian Forex Trading System
Scalping with Gaussian Indicators
Gaussian Bands, and Gaussian Histogram MACD metatrader indicators
Submit by Maximo Trader 05/12/2012
Trading system Gaussian is based on the Gaussian Bands, and Gaussian Histogram MACD metatrader indicators.
Gaussian Bands, and Gaussian Histogram MACD metatrader indicators.
Currency pairs: any.
Time Frame 15min, 30min, 60min.
Metatrader Indicators :
Guassian Bands indicator;
Gaussian Histogram MACD indicator;
AD Filter: Bollinger Band W. indicator.
Buy
Wait that price breaks dot red line (of the Gaussian bands) and Gussian Histogram MACD is above moving average: enter at open next bar.
Sell
Wait that price breaks dot blue line (of the Gaussain Bands) and Gussian Histogram MACD is below moving average: enter at open next bar.
Exit Position
Stop loss for buy 5 pips above red dot line.
Stop loss for sell 5 pips above blue dot line.
Profit Target predetermind depends by currency pairs and time frame (15 min, 30 min, 60 min)
In the pictures Gaussian Forex Trading System in action.
-
#1
hi, indicator not working or showing on mt4. any ideas? please advice
