


XPS v8 and Synergy trading signal
Boss Mode
Submit by Danny (03/02/2013) (The indicators XPS written by Xard777)
BOSS MODE is a trend catching setup, meaning it was designed and built to get you in and out of the trend.
The reason for this is because most pips are made while catching the trend.Inside theOscillator window you will see the Range indicator.
This is real easy to read...
White line above top black line.... price going up
White line below bot black line.... price going down
Now, this indy will show the start of a new move when the white line crosses the black
line especially if the Oscillator has just changed as well.
The drawback to using this indy is even though it is great at showing us when to get in onthe start of a new move, it is much harder to see continuation moves with this indy.
Not to worry. The histo indy that is in the window above the Oscillator is a filter indy :-) This will work hand hand with the range indy to show us continuations in the current trend as well as an exit strategy if you are not already out of the move, if the filter goes against you then it is time to exit.Also the filter indy will help you decide if its a good time to get in.
As a rule of thumb... do not trade against the filter indy... it is there for your
protection.
The higher gann ssl which will show you 4hr on 1hr & 30m chart and daily on 4hr chart.
This way you can see the immediate higher timeframe as it is critical to your decision
making process.
Trading with the higher time frames is preferred.
The smaller Gann ssl is part of your trigger. You want to be in a red smaller gann ssl tolook to sell, and in a green smaller gann ssl to look for a buy.
You want to be in a red small gann ssl with in a yello big gann ssl to sell, and in a green sslwith in a purple big gann ssl to buy.
The DSR in the main chart that looks like a squared cross hair or hash mark, think of itas a zero line, you want to be above it when going long and you want to be below it when
going short. It is there as a confidence booster. Just watch it for a few days and you will see why.
In the picture XPS v8 and Synergy trading signal in action.
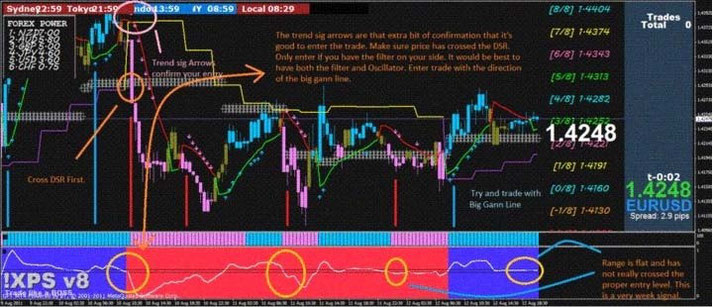
Just remember the Range indicator is very important. You shouldn't take the trade
unless you have the Range white line crossing the Top black line for a buy trade and
cross the Bottom black line for a sell entry.I want the Range line to be facing up or down
when it does it's cross.
A Flat Range line is a weak signal.
Use the Trend signal Arrows to confirms your entry decision. At least until you get the
hang of this setup.
When you get a Trend Sig Arrow, make sure you got Trend bars across the the DSR (
the grey hashmarks), or at least the mid line of the hashmarks before you take your
entry.
DSR. Stands for Dynamic Support & Resistance. It's support and resistance that
adjusts to price while price moves. So you want to break past S & R before taking a
entry on a trade. You might even want to wait for price to retest the S & R that you just
broke thru before you enter a trade.
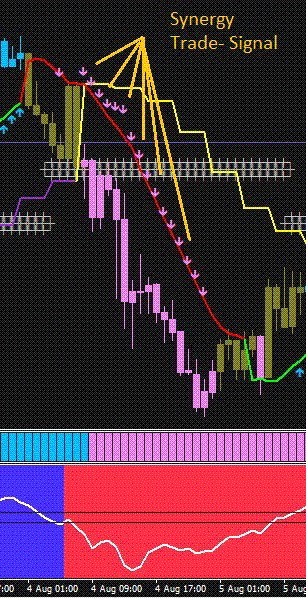
What I mean is say your getting trend signal arrows on each candle and every candle
afterwards, but then on the next candle you don't.
The streak of trend arrows has stopped so this means the trend may have slowed down
or even stoped. So this is something to keep in mind.
Another that you want to pay attention to is the Murrey Math. There a many ways to use
murrey math, and if someone has some ideas on how else to use it here to beter trading
this setup, please let me know.
But as for me, I try to keep it as simple as possible.So what I look is how much price has moved across the murrey math map.
I do this to get an idea to when it may be running out of gas and when it may want to
start going in the other direction.
So say price trends downwards for a while and then it comes into the oversold areas of
Murrey math. The 1/8 and -1/8 area and beyond. Now I'm looking for signs of weekness.
Like a double or triple bottom.
Now that I'm in the over sold area of the murrey math. I'm not looking to take anymore
sell trades.
I'm now looking for the trend to change and go upwards
On Take Profit It will be different for each time frame. I will set a predetermined
number of pips that I want to take profit at. For the 1hr eur/usd for example I would
strive for around 60 pips.
I always open 2 trades on a pair at a time, this way I can try and make the second trade
run.
So I open 2 trades on the eur/usd and set the first trade to take profit at 60 pips or
the nearest monthly pivot, s/r. Once I have taken this first take profit on the first
trade I let the second run until the candles change color against me.
The how point of this is to bag my first trade early to give me leeway to let the second
run.
This is just my style of trading, you should do what works for you.
When it comes to StopLoss. I first set an initial stop loss of 80-100 pips to avoid my
account from being wiped out from some freakish news.
Once I take the trade off the DSR in the direction I want to go, and the trade has
moved my way a little I then move my stoploss to just above or below the last small gann
line entry.
The whole point of me doing this is that I want to get out if the trade goes against me.
When price goes against you and it hits the last high or low of the last small gann line
then the gannline changes and price can be going against you. Keep in mind that when a
trade first begins that it can go up and down until it goes the way it is going to go that
's why I wait until the trade goes my way a little before moving stoploss close to small
gannline.
Again this is just the way I do it, so you should do how ever you feel confortable
trading.
I hope this help.
Xard777 Trading Systems and Metatrader indicatros
Art of Forex Forex System Xard777 - Forex Strategies - Forex ...
XPS V.6 Forex System Xard777 - Forex Strategies - Forex ...
Currency Trader Forex System Xard777 - Forex Strategies - Forex
COG Forex System Xard777 - Forex Strategies - Forex Resources
X Chart Forex System Xard777 - Forex Strategies - Forex
Murrey Math Harmonic Octave Trading System - Forex Strategies ...
Touchline Forex System Xard777 - Forex Strategies - Forex ...
