


181# Forex Inspector Scalping System
Emiliano Quantitative Trader 2026
Forex Inspector Scalping System is a trend-following scalping strategy that utilizes dynamic support and resistance levels, represented by the stepped white lines, to identify entry points. It is designed for high volatility to capture quick moves.
SETTINGS: The recommended timeframes are M1, M5, M15, and M30, as the screenshots show these working effectively. The best pairs are volatile instruments. The screenshots show XAUUSD (Gold), but other good pairs include GBPJPY, NAS100 (US100), US30 (Dow Jones), or BTCUSD. The only indicator required is the Forex Inspector Scalping indicator, which consists of visual components like White Stepped Lines, Arrows, and Colored Squares.

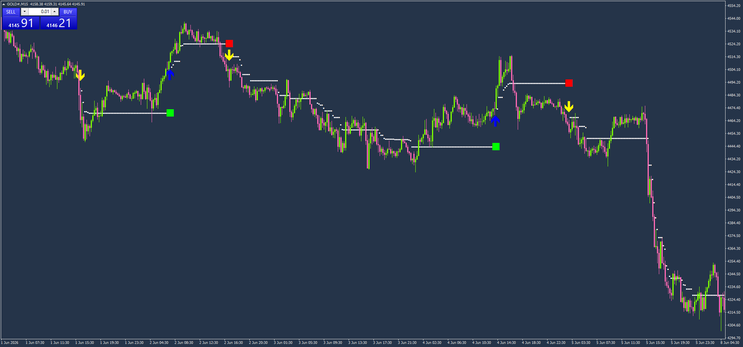
INDICATOR COMPONENTS GUIDE: The White Stepped Line acts as a dynamic Trailing Stop and Trend Direction line. If the line is above the price, the trend is Down (Bearish). If the line is below the price, the trend is Up (Bullish). The Yellow Arrow pointing down indicates a potential Sell signal or Bearish reversal. The Blue Arrow pointing up indicates a potential Buy signal or Bullish reversal. The Red Square is a confirmation marker for a Sell entry or resistance level. The Green Square is a confirmation marker for a Buy entry or support level. The Orange Dashed Line indicates the Take Profit (TP) level, and the Green Dashed Line indicates the Entry Price level.

TRADING RULES FOR LONG (BUY) SETUP: The price must be trading above the White Stepped Line, or the line must flip to below the price, indicating an uptrend or support hold. Wait for a Blue Arrow pointing up to appear. Look for a Green Square appearing near the price action, often aligning with the White Stepped Line and acting as a floor. Open a BUY position at the close of the candle where the Blue Arrow and Green Square appear. Place the Stop Loss just below the Green Square or the most recent step of the White Stepped Line. Target the next resistance level, which is the next step up of the white line, or use a fixed Risk to Reward ratio like 1:2. In the screenshots, the orange dashed line indicates the TP.
TRADING RULES FOR SHORT (SELL) SETUP: The price must be trading below the White Stepped Line, or the line must flip to above the price, indicating a downtrend or resistance hold. Wait for a Yellow Arrow pointing down to appear. Look for a Red Square appearing near the price action, often aligning with the White Stepped Line and acting as a ceiling. Open a SELL position at the close of the candle where the Yellow Arrow and Red Square appear. Place the Stop Loss just above the Red Square or the most recent step of the White Stepped Line. Target the next support level, which is the next step down of the white line.
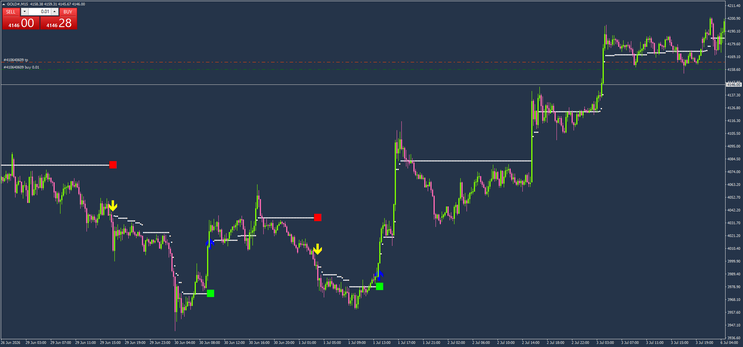
EXAMPLES FROM PHOTOS: In the first image showing the M1 Chart Downtrend, notice the White Stepped Line stepping down from 4173 to 4150. This is a strong downtrend. The Yellow Arrow at the top around 4173 signaled the start of the drop. Every time the price pulled back up to touch the White Stepped Line, the steps rejected it and it went lower. This is where you would look for Sell signals. Around 07:00, a Blue Arrow appeared with a Green Square, signaling a temporary bounce or Buy, but the main trend was down. In the third image showing the M5 Chart Reversal, look at the bottom right around 1 Jul 13:00. The price was falling and the White Line was above. Then, a Blue Arrow appeared pointing up, and a Green Square marked the bottom at roughly 3974. The White Stepped Line flipped to below the price. This was the signal to BUY, and the price then rallied significantly to 4023.
RISK MANAGEMENT TIPS: Since this is for volatile pairs like Gold, ensure your lot size is small, such as 0.01 as seen in the screenshots, to manage risk. Be careful trading on M1 during low-volume hours like the late Asian session as spreads might eat into profits. If the White Stepped Line is flat or horizontal for a long time, the market is ranging. Wait for the line to step again before entering.


181# Bollinger Bands Stop Forex Trading System
Submit by Janus Trader 30/01/2012
Time Frame 5-15 min
Currency Pair: all.
Session:London and Newyork.
Trade Setup indicators:
EMA(50) and EMA(100) both applied to the candle close.
This is what determines the "trend". If EMA(50) is above EMA(100) we will only be looking for a Buy trigger. If EMA(50) is below EMA(100) we will be looking for a Sell trigger.
Trade Trigger Indicators:
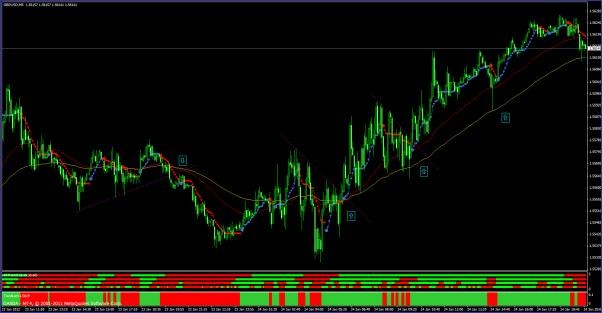
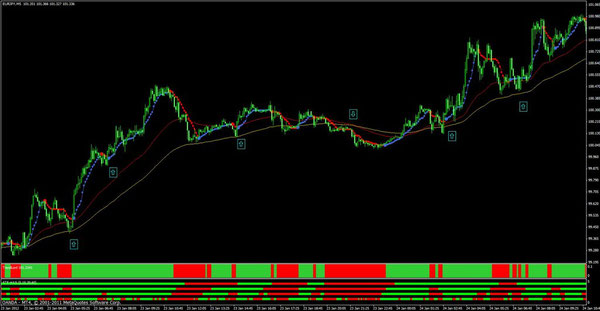
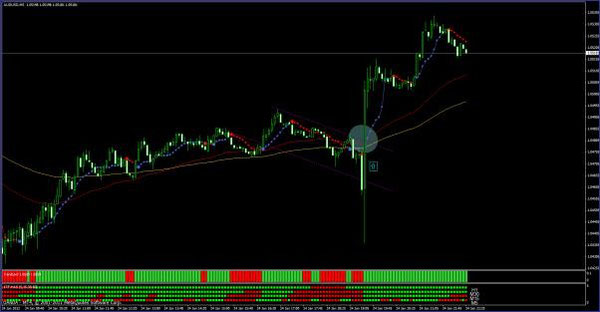
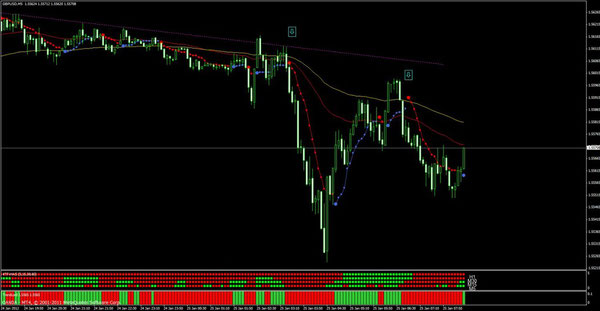
BBands Stop (8,2,0.2,1,1,1000, true) applied on the chart with blue and red colours. IfBBStop is blue it means long if BBStop is red it means shortl. However, what we will take as a Sell trigger is that BBStop has turned red, and is BELOW both the EMA(50) and EMA(100). ALSO the price has crossed below the candle where theBBStop "large red dot" appears. This large red dot is the start of the down trend according to BBStop. This large BBStop dot will produce an alert on your platform so it is a nice way to let you know we might be getting a trend setup soon. Reverse the above for a Buy.
Trade confirmation Indicators:
These are TrendLord and 4TF-HAS are used to confirm your trade. Once the setup and trigger indicators are all lined up for you to take trade, take a final look at the confirmation indicators to make sure they agree with your decision. The 4TF-HAS and Trendlord have to be red for a sell, and green for a buy. A word of caution about these indicators when your charts get stale (not updated in a while your screen saver kicks in or whatever), you may need to refresh your charts by switching to a diffrent time frame and back to the desired time frame on the chart to refresh the indicator.
That is the basic system in a nutshell. There will be many details to iron out I am sure such as TP target, SL placement, re-entering a trade, etc. I generally like to use the last swing high/low (or the big dot) as my SL, and then set my TP target as 1:1 on 1/2 my position and 1:2 on second 1/2 of my position and using a jumping stop on this second 1/2 position. I am sure there are many ways to manage a trade and this can be discussed in the thread among followers as each trader's comfort and risk level is different than others. I will be giving general guidelines, but then again nothing is etched in stone here.
Extra Indicator:
AFST Exact entries is a pivot point calculator that places the daily pivot points on your chart. If you would like to use those as possible turning points or TP/SL targets, you can use this indicator (with default settings) at your discretion.
In the pictures Bollinger Bands Stop trading system in action.
Share your opinion, can help everyone to understand the forex strategy.

Bollinger Bands Forex Strategies
13# Bollinger Bands Bounce - Forex Strategies - Forex
155# Bollinger Bounce Scalping - Forex Strategies - Forex ...
152# Bollinger Band Scalping - Forex Strategies - Forex
181# Bollinger Bands Stop - Forex Strategies - Forex Resources
188# Bollinger Bands and Stochastic - Forex Strategies - Forex ...
114# Awesome and Bollinger Bands Scalping - Forex Strategies
168# Price Action Scalping III - Forex Strategies - Forex Resources
Bollinger Bands Forex Strategies
16# Bollinger Bands with ADX, RSI and Two MA - Forex
206# T3MA Scalping - Forex Strategies - Forex Resources - Forex
201# T3 Clean and Bollinger Bands - Forex Strategies - Forex ...
65# Bollinger bands Spike scalping - Forex Strategies - Forex ...
2# Cross Midlle band - Forex Strategies - Forex Resources - Forex
16# Bollinger Bands scalp GBP/JPY - Forex Strategies - Forex ...
88# Bollinger Bands and RSI Scalping - Forex Strategies - Forex
6# Bollinger Bands Reversal - Forex Strategies - Forex Resources
204# Stochastic, Bollinger Bands and LWMA's - Forex Strategies
4# Bollinger Bands, and CCI - Forex Strategies - Forex Resources
18# Bollinger Bands and RSI Divergence - Forex Strategies -
11# Bollinger Bands Breakout and RSI - Forex Strategies - Forex
21# Bollinger Bands and SVE Bollinger Bands - Forex
1#Deviation Bands System - Forex Strategies - Forex Resources ...
15# Bollinger Bands and ADX - Forex Strategies - Forex
55# Bollinger Bands Exit System - Forex Strategies - Forex ...
14# Bollinger Bands, RsI And Stochastic - Forex Strategies -
60# Magic Bands: Scalping Method - Forex Strategies - Forex ...

Write a comment