


489# StepMA chart with MA distance
StepMa chart trading
Submit by Lukas 01/11/2015
StepMA chart with MA distance is an trend following strategy based on Stepma chart. This is a good tool for manage the position. You can apply Step MA chart at any time frame. This indicator also helps relieve stress from trading.
This strategy is also used a new indicator really interesting:distance MA Distance from price alert.
This is only an idea for trading with StepMa chart.
Time Frame 5min or higher.
Financial Markets: any.
Metatrader indicator:
Stepchart (34),
MA Distance from price alert indicator,
THV Pivots only from intraday trading.
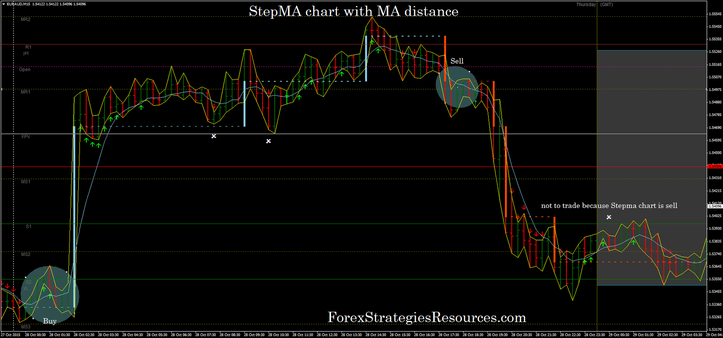
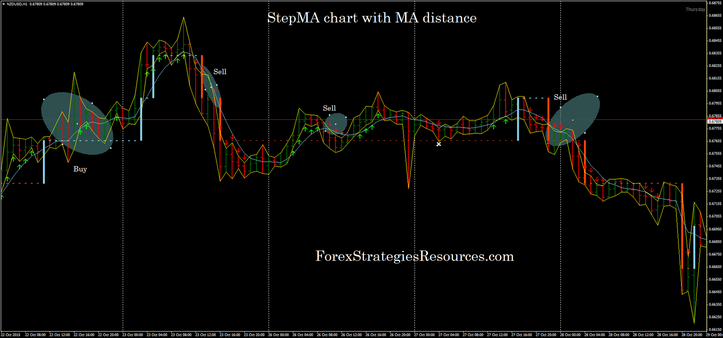
Trading rules StepMA chart with MA distance
Buy
Price above aqua dot Step MA chart.
Aqua dot of the StepMa chart,
Buy arrow of the MA Distance from price alert indicator.
Sell
Price below red dot Step MA chart.
Red dot of the StepMa chart,
Sell arrow of the MA Distance from price alert indicator.
Exit position
For stop use the levels of StepMA chart, red dot levels for sell and aqua dot levels for buy: apply a buffer of 10-25 pips above or below the levels depends by the time frame.
Exit position at the opposite arrow or at the pivots levels.
In the pictures the StepMA chart with MA distance from the price alert in action.
Share your opinion, can help everyone to understand the forex strategy

Write a comment