571# Forex Ultra
Buy Sell pressure.
Submit by Dimitry
Forex Ultra is a trend momentum system based on more indicators that are a solid filter false signals.
The following explanation is a translate from the russian make with google translate.
Time Frtame 5 min or higher.
Currency pairs: majors.
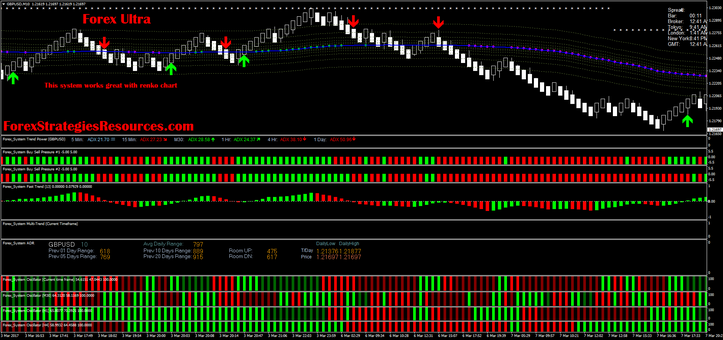
In Figure 1, you see a graph of the FOREX Trading system. Each element of the system is numbered and described below.
1) "FOREX Trading Entry Arrows with Alerts". Before starting the transaction settings, you will see a large arrow that appears when the candle is closed. The arrow is pointing towards the alleged deal, the green arrow is up for purchase, and the red arrow is down for sale. Depending on the readings of the other indicators, this arrow may not be a signal to enter.
2) "FOREX Trading Buy Sell Pressure # 1 and Buy Sell Pressure # 2". They are based on the use of
Price and momentum. When opening a trade it is necessary that these indicators are consistent with Entry Arrows with Alerts and other indicators. How the indicators are "coordinated" will be considered further.
3) FOREX Trading Fast Trend. It is necessary that it be consistent with Entry Arrows with Alerts and other indicators before opening a position. The indicator FOREX System Fast Trend should not be above or below the zero line to generate a signal, it should be just the right color.
4) FOREX Trading Trend Power. This window in the FOREX System interface is not used to define the trading entry. This indicator gives us an idea of whether the pair is currently in a trend state or in a lateral phase. The principle of working with this indicator on all time ranges, before daylight is very simple. A gray number with a tilde below 23, which appears behind the indicator, means that the pair is in a sideways trend (goes up and down in a small range) in a particular timeframe. A pair that is in the range is not a good pair for trading, it is unlikely that good signals will be generated on it. A red or green number with a diagonal arrow means that the trend is currently gaining momentum in this time range in the direction of the arrow. The larger the number following the arrow, the stronger the trend. Changing the value up or down corresponds to the strengthening or weakening of the trend. This indicator is based on ADX.
5) FOREX Trading ADR. This indicator automatically calculates the average daily range of the currency pair. Although we do not use this information to determine the entry points and exits, it is necessary for us to determine the size of the position (lot) when trading a particular currency pair. Along with the current average daily range, you see the history of the previous 1.5, 10 and 20 day ranges. ADR also displays the current daily high or low and the approximate possible up or down movement within the range.
6. "FOREX Trading 'Real Price' and Channel". This combination of indicators displays the "actual" price of the pair in the form of a straight line, as well as the channel of the deviations of the moving averages. He also draws red and green dots on the blue line of "real price" when closing the candle, if the current trend is strong.
7) FOREX Trading Support and Resistance. This indicator is a real treasure. He automatically puts on the schedule the last levels of support and resistance. Instead of applying these lines manually, you can rely on the indicator. Support and resistance levels are excellent levels for fixing profit on positions if the pair is not traded in a rigid range and to predict breakdowns. FOREX System Support and Resistance automatically draws the current Fibonacci levels and on the right side of the chart. Fibonacci levels are used by traders to predict the movement of prices.
8) FOREX Trading Clock. This indicator shows us the time in Tokyo, London and New York - the three main trading areas of the currency roar. Since most brokers work with GMT, for many it is difficult to calculate the necessary time. Using the Forex System Clock indicator will help you to find out which markets are open and in which part of the day in different shopping areas we are located. Also in the top line, we see the calculation of your broker's current spread. This is very useful if your broker changes the spread at certain times of the day or at the time of exiting
News. Also, the clock shows you how much time has passed since the beginning of the candle being formed.
9) FOREX Trading Multi-Trend. This indicator uses the algorithm of tracking price movement on several time ranges and determining the strength and direction of the current trend of the pair. Thick red and green bars signal a strong trend, while thin light green and light red bars signal a weakening of the trend and a possible change in direction.
10) FOREX Trading Oscillators. These indicators are based on the algorithm for combining so-called oscillators (such as RSI, Momentum and Stochastic) in order to show the conditions of overbought and oversold over time bands larger than the one on which we trade.
Note: When you change the time range on the chart, you need to reload the template so that it matches the new time ranges, otherwise the chart will display incorrect oscillators. Forex Trading Oscillators always show (from top to bottom) the current time range and the next three higher time ranges. On the left, in the indicator window, the time range is visible.
11) There is no indicator at number 11 on the chart, however, if you look at the background of the chart, you will see different colors. This background is adjusted using the indicator "FOREX Trading i-ParamonWorkTime". This indicator allows you to select certain time zones of the day. I highlight the European (London) and New York sessions, since it is during these sessions that the largest volume of trades is registered. You can adjust this indicator at your discretion by changing the beginning and end of the time interval.
Now let's move on to the rules of the FOREX Trading trading system.
Trading plan FOREX Trading.
You can trade any currency pair with this system, but it works best with the main currency pairs (EUR / USD, USD / CHF, USD / JPY, GBP / USD) on small time bands - 15 or 30 minutes. You can also trade on 5-minute charts, but you should remember the fact that there is a lot of noise on this time range, which will lead to an increase in the number of losing trades. You can also trade other currency pairs, but the major currency pairs seem to give the best combination of volume and stability for this system.
Open positions than using 30-minute and hourly charts, however on them you will receive much more false signals. You need to determine your predisposition to risk and then choose a time range. Personally, I prefer to trade on 15-minute charts.
Since this system is an intraday system, it is better for you to choose the watch with the largest volume for trading. It is about the European and the first hours of the New York sessions (approximately from 11.00 pm and 1.00 Moscow time). If you can not trade at this time, you can try to trade in pairs, which include the Japanese yen during the Tokyo session (starting at 2:00 Moscow time). During this session it is better to trade pairs such as USD / JPY and EUR / JPY.
If you are new to Forex, you should start with one of the four major currency pairs (EUR / USD, GBP / USD, USD / JPY, USD / CHF) and focus on it. You can find out how the currency pair behaves and how it reacts to economic reports, having worked with it for a certain time. If you have learned how to trade a currency pair, choose another one. Practice, therefore, until you learn how to trade several currency pairs simultaneously. However, the limitations of your processor can limit the number of traded currency pairs, since FOREX Trading requires a lot of "brains" for constant calculations. If you see that the computer "slows down" or "hangs", then you will have to close some of the graphs.
Entrance.
There is only one simple login in this system. FS Alert Arrow, FS Buy / Sell Pressure, FS Fast Trend, FS Multi-Trend and FS Oscillator must match when the candle is closed. In other words, for a sale transaction, we must observe the RED indicator of the Forex_ Trading Entry Arrows with Alerts on the chart, all other indicators must also be RED. FS Oscillator can be bright red or dark red. The opposite is true for a purchase transaction. GREEN arrow The Forex_ Trading Entry Arrows with Alerts must match the green color of the other indicators.
It is worth noting that not necessarily all four conditions must be observed at the same time. You need to wait until all indicators turn red or green. However, if the wait takes too long (several hours or more) after the Forex_Travel Entry Arrows with Alerts signal, then perhaps you should skip this deal.
The faster the indicators are the same, the higher the probability that you will enter into a lucrative deal with a large price move. However, remember: you can not fly faster than a bullet, you need to wait until all the indicators are the same, although this is psychologically difficult. Indicators are designed in such a way as to filter false movements and protect the trader from losing trades. It is better to lose a few pips at the very beginning of the movement than to open a losing trade. Indicator FOREX Trading Fast Trend must not cross the zero line. In FOREX Trading signal is not the intersection of the zero line, but the color of this indicator.
So, after the arrow of the indicator FS Entry Arrows with Alerts appeared, we should check the indications of other indicators. If all the indicators are consistent, then we accept the signal to the input. In the first case, after the appearance of the red arrow, none of the indicators confirmed the signal. In this case, you can not open a sell order. Then a green arrow appeared. All the indicators quickly turned green. We open this position. As a result of several hours, it could bring you about 60 pips, and at the end of the day more than 100 pips.
Remember: the indicators can change color in any order, but in any case do not open the position until all conditions are met and the candle is not closed!
A few thoughts about the entrances.
You can trade on the FOREX Trading system at any time, however the probability of success increases or decreases depending on the time of day when you trade. The largest volume of trading falls on the European and New York sessions (03: 00-17: 00 EST). At the same time, the largest volume is reached when trades in these two financial centers intersect, i.e. Approximately from 09:00 to 12:00 EST. The more time ranges we use (for example, 4-hour or day-time), the less important is the time factor for us. However, on short-term time frames, such as hour or less, the time of day can have a big impact on your transactions. The slowest movements during the day on Forex occur between the closing of trading in New York (16-17 EST) and the opening of trading in Tokyo (19-20 EST), and even after that the volume of trading is still very thin compared to the European session.
You also need to take into account such a factor as economic news for the country or currency pair that you are trading. In the period preceding the main news releases (data on the US labor market, decisions on accounting rates), the volume, as a rule, decreases. The publication of news itself can cause a "price shock" if the news was unexpected (not the same,
As economists predicted). These situations can reduce the reliability of the FOREX System indicators, so you should be careful when opening positions before or after the release of news releases.
It is also not recommended to trade on holidays and weekends. And we are talking about all the holidays, not just about the holidays of the country in which you live. If a holiday in England, and you live in the US, it is quite possible that you will simply lose time (and maybe money) by trading during the European session. On holidays, the trading volume is significantly reduced, as banks are closed, although the market itself can work. In economic calendars along with news releases are holidays.
Exit rules.
Unlike entry rules, which consist of only one item, the outputs in the FOREX Trading system have several alternatives. Moreover, there are several elements that are provided at your choice.
Output option 1. Support and resistance output.
Exit rule 1 is used only under certain conditions. When you open a position, pay attention to the level of the indicator FS Support or Resistance, which will be your profit target. If the distance from the entry level is sufficient (30-40 pips or more depending on the currency pair), you can select this level (support / resistance level) as the profit target. If the support or resistance is close to the entry point, then the reason for this is that the pair has consolidated in a narrow range and signals a breakdown of this range. Breakout deals are usually the best deals, as you can earn a big profit. A breakdown in the level of support or resistance usually means that movement can occur at 75, 100, 150 pips before colliding with the next support or resistance level. You need to understand this, so as not to set the automatic take-profit at a distance of 15-20 pips from the entrance, when you can earn hundreds of pips. Figure 3 shows an example of the correct use of FS Support or Resistance for determining the profit target.
Note that at the time of entry to the next resistance level, the distance was almost 60 pips. For a 15-minute chart, that's a lot. This is quite a suitable distance in order to establish at this level an automatic profit target, placing a sell order at this level. Of course, there is no guarantee that the price will reach this level, but there is a high probability that if the price goes in the direction of the position it will reach this level before it turns in the opposite direction. When you set profit using the FS Support and Resistance indicator, remember that the price should be subtracted from the spread of the currency pair. In this case, we have a spread of 3 pips, so you need to subtract it from the profit goal. I usually subtract a few more pips from the target than the spread to make sure that the price does not close to the level without reaching it).
Of course, the price can go through this level of resistance and continue moving in your direction, however, a profit of 60 pips on one transaction is an excellent goal and it is better to exit with this profit. Look at chart 3, notice how during the next 15-20 candles the price touched the resistance level several times, but did not break it. On this transaction, you earned the maximum possible number of pips, closing it at the resistance level.
Exit option 2. Using a combination of the indicator Buy / Sell Pressure and FS Multi-Trend
Another way to exit is to exit when you change the color of the Buy / Sell Pressure and FS Multi-Trend indicators. This output signal is discretionary. A more conservative trader can close a position if two or three Buy / Sell Pressure # 1 bars have changed color, even if Buy / Sell Pressure # 2 has not changed color. If you are more susceptible to risk, you can wait for a change in the color of Buy / Sell # 2 or Multi-Trend. I usually wait for the color change Buy / Sell Pressure # 1
And FS Multi-Trend on the same bar. I ALWAYS close the position if Buy / Sell # 1 and Buy / Sell # 2 change the color at the same time.
Today is a great day.
Trend Momentum Trading