


526# Xard Chart 2016
Xard Chart 2016 an intraday system
Submit by Lorenz ( programmed by Xard777).
Xard Chart 2016 is an intraday forex strategy trend-momentum? or this is a tool Metatrader 4 template that you can use for trade in others ways? The interpretation of this this tool is free: trend momentum, reversal, SR .
Time frame 5 min and 15 min.
Financial markets:any.
Metatrader Indicators:
MA4X -Bid Ratio V.1.6,
MT4X-Math,
MT4X-Round Numbers,
MT4X Sessions,
MT4 Xard trading line,
MT4X Support and Resistance.
MT4X Stochastic.
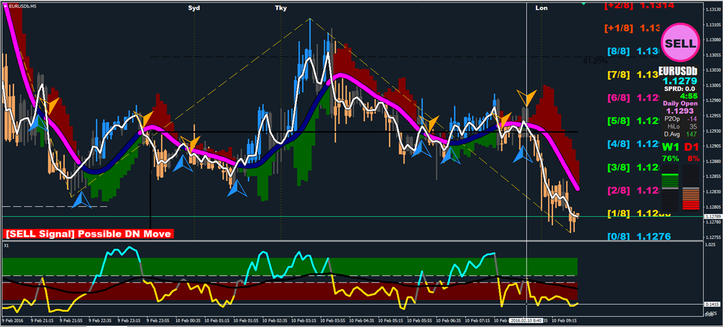
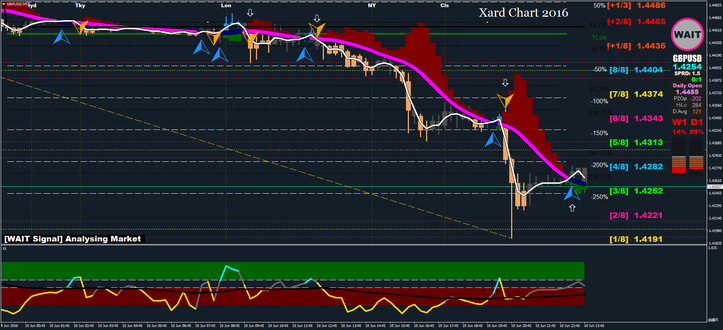
Simple interpretation
Trend-momentum trading
Buy
Arrow buy
Stochastic crosses upward ( line cyan color);
Xard trading line blue color with green cloud.
Sell
Arrow sell
Stochastic crosses downward ( line yellow color);
Xard trading line red color with red cloud.
Exit position
The SR lines and Murrey Math are possible profit target.
Place initial stop loss at the previous swing high/low.
In the pictures Xard Chart 2016 in action.
To find other Xard777 systems using the search with the key: Xard777
To download this file write the following link into the url.
https://drive.google.com/folderview?id=0Bwjv2Pbf48itdVZUTjlKemp5dzg&usp=sharing
