


121# Ichimoku Kinko Hyo Forex Strategy
Ichimoku Kinko Hyo Forex Strategy
Submit by MavenTrader 18/02/2012
The Ichimoku
kinko Hyo indicator is
designed of five lines called the tenkan-sen, kijun-sen, senkou span A, senkou span B and chickou span plus an area called kumo, it is the space between Senkou Span A and Senkou Span
B. Ichimoku Kinko
Hyo technical indicator is one of very powerful indicator and can bring can bring consistent results if used wisely . This indicator include in forex
trend trading because it
can predefined to characterize the market trend, support and resistance levels, and to generate clearly signals of buying and selling.
There are many ways to trade
forex using Ichimoku Kinko
Hyo , and here is one of the best forex trading
strategy using Ichimoku chart pattern.
Forex Indicators set up:
1. Ichimoku (7,22,44) I don't know if there are better settings for this.
2. Stochastic Oscillator (Fast at 14,3)
3. MACD (2,10,4) or (3,15,5)
4. Fibonacci Retracement as well as other supports and resistances from other time charts.
Once all these are set we can now look at a chart. Starting from the first candle circled in yellow to the far left we notice that it is touching the red Kiju-Sen line of the Ichimoku Kinko Hyo
indicator. This line is going to be very important to us as well as the clouds.
After we have confirmed that it has touched the Kinju-Sen line we look down at our other indicators to confirm our position. In this case it is showing us a strong sell signal because if you look down at the Fast Sto the signal line is below as well as for the MACD. This is how we confirm this short position.
1. Is the candle touching the Kinju-Sen? Yes/No
2. Is the Stochastic showing a sell signal? Yes/No
3. Is the MACD showing a sell signal? Yes/No
If all three indicators give us a yes then this is a confirmation to open a position. And If no to any then you do NOT have Confirmation! To maximize your profits, set up your chart not only for
1H time frame. But set them up for smaller or even larger time frames (Smaller time frames will help you decide the markets direction for a larger time framed chart as well as larger time frames
will give you key hints as to the trend/direction of smaller time framed charts). As you can see I drew support and resistance lines from
the30min chart. Here
is two scenarios of how this first trade could have gone down.
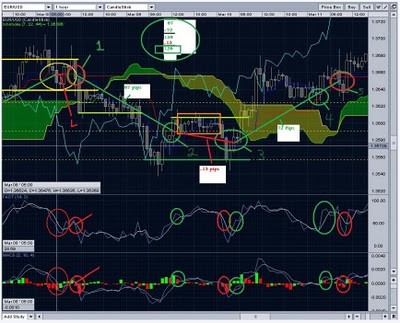
Look at the red circle #1. As you notice in #1 it gives us a sell signal. All indicators say yes to sell so we do. We set a stop of about 20-30 pips and we wait. So after an hour or so we notice that our trade has broken its support. And down it goes staying within the uprights. It breaks through the small Ichimoku cloud which because this cloud is not very large its
not really that exciting to us but then it breaks support again! and continues down. Until it hits a lower support line and comes back up to our Kinju-Sen line where in #2 it gives us a buy
signal again to close our position and to open another trade if we want too.
We have closed our short (sell) position from #1 green/red circle and now open a long (buy) position at the #2 green circle because all indicators say yes. In this case because we are trading
only on the Kinju-Sen line we would have taken a loss. We didn't know where to take our profit so we took a loss. This is okay its fine relax.
We have moved on to #3 green circle where we close our previous long position with a loss and open a new short position. Now before we move on I want to add something else. As you notice the
Kinju-Sen lines goes horizontally and we lose some pips by closing our previous short once again and open a new long position. Here is one thing I want you
to take a look at and test on your own.
Okay so take a look at the first close/open candle in #3. You will notice that the first candle gives us a close/open position but the second candle does not because not all indicators say yes. The Kinju-Sen line does not touch the next candle. This is good because the following candle means we can now close/open a new position (Like
we have just done above) or in other cases add to our confirmation or to our position. Now take a look at how that candle confirms our new long (buy) position but the next candle does too? This
is where a rule comes in.
• When closing/opening a trade we look to the next candle and if that candle is NOT touching the Kinju-Sen line then we can close/open a new trade on the second candle from our new
position.
• If the first and second candle do touch then we must wait till the third or even the fourth candle to open/close a new trade.
• If we have waited on the third candle and it touches and still gives us a buy then we can add to our position.
Take a look at our new position #3 the second confirmation candle. As you can see
the market moves up on our long position. It blows through the Ichimoku cloud and continues upward to #4 green circle. This is where the rule comes in again. It has been far more than 3-4 candles
away and it doesn't confirm a close/short position but it confirms another buy position so we add to our long. It continues up to #5 red circle where it confirms a close/short position. We have
now closed all our trades on this chart. We may have played #5 like we did in #3 or we may have played it even better.
To recap from #1-#5 we made a total of about 6 trades. The numbers are off on my chart but it is very close. Spread was not taken into consideration when doing those numbers. As well as the
trades between the first confirmation in #3 to the next one in #3 and #4 was left out.
A total of 126 pips is not bad for three days of work. It was a modest play and this chart was a really great set up to display how this strategy works. Remember while you are trading and waiting
on this 1 hour chart you can also be scalping lower timed charts of the same pair. This depends on your broker but if you have two accounts then you are golden.

Write a comment
Antonio (Thursday, 30 April 2026 19:59)
Very good system