


103# System 500 Trading System
Submit by Joy22 (written by Colin Atkins)
Getting Started
‘System 500’ allows the user to trade over long periods in a calm manner with no need to rush to get onto a trade. You can take your time analysing the setup and even take a number of hours before making your final decision if you wish. The typical duration of a trade is 2 – 10 days. ‘System 500’ identifies trends and allows the user to then trade with the trend.
Charts Setup
1. Open your charting package
2. Open a currency / Forex chart e.g. GBP/USD
3. Change the chart candle periods to 4 hours
4. Remove any indicators you may have on this chart
5. Add the following indicators:
a. Exponential Moving Average (EMA) period set to 2 coloured Blue
b. Exponential Moving Average (EMA) period set to 6 coloured Black
c. Exponential Moving Average (EMA) period set to 12 coloured Green
d. Exponential Moving Average (EMA) period set to 34 Coloured Red
e. Bollinger Bands with no change to settings
6. Open an additional chart on the same currency / Forex pair
7. Change the chart candle period to Daily
8. Duplicate the settings for EMAs and Bollinger Band (as in point 5)
9. Open an additional chart on the same currency / Forex pair
10. Change the chart candle period to Weekly
11. Duplicate the settings for EMAs and Bollinger Bands (as in point 5)
12. Save these 3 charts as a template if possible (dependant on your charting package) Call the Template System 500.
Trading System 500

How ‘System 500’ Works
‘System 500’ works by finding entry points during a confirmed trend. I don’t worry about getting in at the start of a trend or a reversal. We are ‘trend riding’, getting on to the trade when it is already in motion.
This way we can greatly increase our chances of success buy taking advantage of buying or selling momentum that is already ‘in play’. System 500 uses a unique strategy that works!!
These are the 7 currency pairs that we trade...
AUD/USD
EUR/JPY
EUR/USD
GBP/USD
USD/CAD
USD/CHF
USD/JPY
Establishing the Trend
Buy Trades for rising prices – In an UP TREND “Going Long”
1. Look at the 4 Hour chart.
2. Look at the Bollinger Bands. The price (candle(s) must have broken through (pierced) the Lower Band.
3. Staying on the 4 Hour chart. The Blue EMA 2 (Exponential Moving Average) must clearly cross ABOVE the Black EMA 6.
Rule: The Bollinger band must be pierced ‘AND THEN’ The EMA 2 must cross the EMA
6. This is your trade signal.
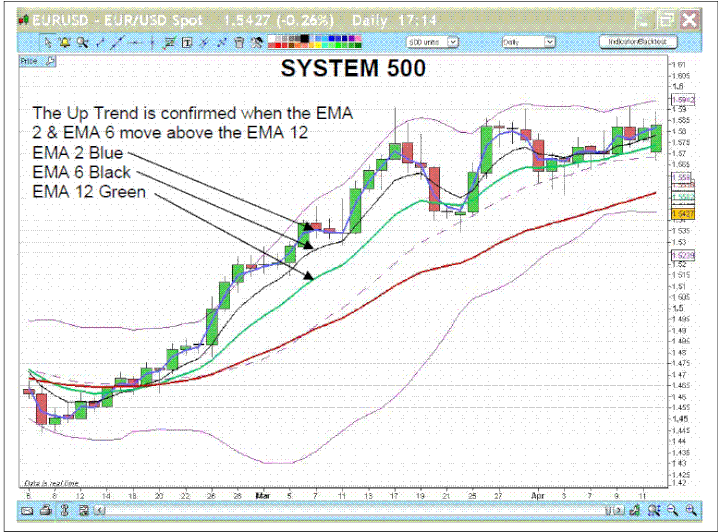
4. Now look at the Daily chart to confirm that the correct trend direction is in force, in this case upward.
5. On the Daily chart: The Blue EMA 2 must be ABOVE the Black EMA 6. Both EMAs must be angled upwards and clearly separating (see example below)
6. On the Daily chart: Both the Blue EMA 2 and Black EMA 6 must clearly be ABOVE the Green
EMA 12.
7. If points 5 and 6 are confirmed we consider an UP TREND to be in effect.
Sell Trades for falling prices – In a DOWN TREND “Going Short”
1. Look at the 4 Hour chart
2. Look at the Bollinger Bands. The price (candle(s) must have broken through (pierced) the Upper Band.
3. Staying on the 4 Hour chart. The Blue EMA 2 (Exponential Moving Average) must clearly cross
BELOW the Black EMA 6.
Rule: The Bollinger band must be pierced ‘AND THEN’ The EMA 2 must cross the
EMA 6. This is your trade signal.
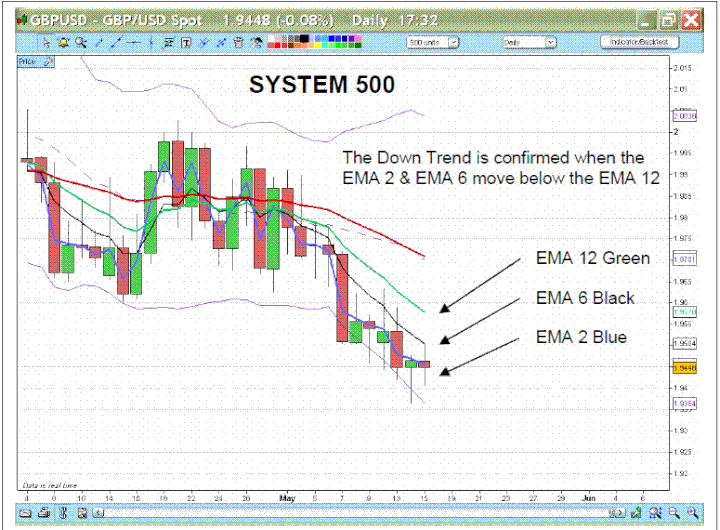
4. Now look at the Daily chart to confirm that the correct trend direction is in force, in this case downward.
5. On the Daily chart: The Blue EMA 2 must be BELOW the Black EMA 6. Both EMAs must be angled downwards and clearly separating (see example below).
6. On the Daily chart: Both the Blue EMA 2 and Black EMA 6 must clearly be BELOW the Green
EMA 12.
7. If points 5 and 6 are confirmed we consider a DOWN TREND to be in effect.
Exit Strategies
To capture the biggest moves possible our main reason to exit trades are:
1. The EMAs crossing
EMAs crossing back over on the ‘lower time frame’.
a. A potential exit is reached when the EMA 2 crosses the EMA 6 and they both cross the
EMA 12.
b. The confirmation should be found by waiting for a new candle to start. If the EMAs are
still crossed the exit should be taken.

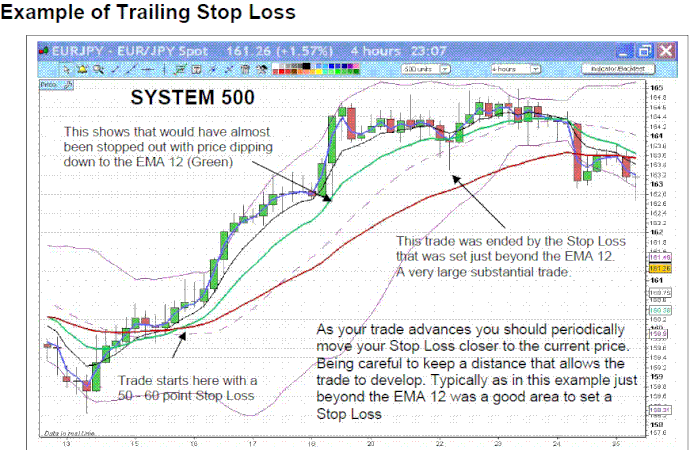
2. Stop Loss Is triggered
A Stop Loss or Trailing Stop Loss is triggered
a. All trades should be backed up with a Stop Loss or Trailing Stop Loss.
b. Your Stop Loss should initially be set to approx 50 – 60 points
c. When the trade is fully under way you can adjust your Stop Loss to either
i. 20 points beyond the EMA 12
ii. 10 points beyond the EMA 34
iii. Your decision of which to choose will be lead by previous price action. To find
out what this means look back through your chart and see if the price tends to
move back to the EMA 12 level or as far as the EMA 34.
As your trade moves into profit you should move your ‘stop loss’ in the same direction behind it and keep doing this to lock in your profits. To determine how far behind you should keep your ‘stop loss’ take a look at previous price action. You need to give the market enough room to breath. Measure how big the previous price swings have been. Quite often you will see that the
price comes back to the 12 EMA or 34 EMA.
Read the manual for further
Bollinger Bands Forex Strategies
65# Bollinger bands Spike scalping - Forex Strategies - Forex ...
6# Bollinger Bands Reversal - Forex Strategies - Forex Resources
88# Bollinger Bands and RSI Scalping - Forex Strategies - Forex
114# Awesome and Bollinger Bands Scalping - Forex Strategies
16# Bollinger Bands scalp GBP/JPY - Forex Strategies - Forex ...
4# Bollinger Bands, and CCI - Forex Strategies - Forex Resources
7# Bollinger Bands Trend - Forex Strategies - Forex Resources ...
14# Bollinger Bands, RsI And Stochastic - Forex Strategies -
13# Bollinger Bands Bounce - Forex Strategies - Forex Resources
188# Bollinger Bands and Stochastic - Forex Strategies - Forex ...
17# Bollinger Bands and Equidistant Channel - Forex Strategies ...
18# Bollinger Bands and RSI Divergence - Forex Strategies -
15# Bollinger Bands and ADX - Forex Strategies - Forex
12# Bollinger Bands and Fibonacci Retracement - Forex
16# Bollinger Bands with ADX, RSI and Two MA - Forex
11# Bollinger Bands Breakout and RSI - Forex Strategies - Forex
181# Bollinger Bands Stop - Forex Strategies - Forex Resources
33# Pin Bar, Bollinger Bands and Jma Starlight - Forex Strategies
57# Scalping with Money Flow Index and Bollinger Bands - Forex
55# Bollinger Bands Exit System - Forex Strategies - Forex ...
80# Starc Bands with Bollinger Bands - Forex Strategies - Forex
152# Bollinger Band Scalping - Forex Strategies - Forex
Bollinger Bands Metatrader Indicator - Forex Strategies - Forex ...
