


71#3 Duck's Trading System
Submit by JanusTrader
The system will help you identify buying opportunities in the direction of the last uptrend and selling opportunities in the direction of the last downtrend. The “ducks” in the title comes from the saying “to have all your ducks lined up” an expression meaning to have everything in the correct order. There are three ducks, the first duck will help you to identify the last up or down trend, the second duck helps to confirm the direction of the trend and the third duck will help to identify buying or selling opportunity in the direction of the trend.
This system involves using three different timeframe, a 4 hour chart (first duck), a 1 hour chart (second duck) and a 5 min. chart (third duck). A 60 period simple moving average is applied to all three timeframes. That’s what I call keeping it simple!
How it works:

The first thing we need to do is look at our largest time-frame (4hr chart) and see if current prices are above or below the 60 sma. From this chart we can see that current price is above the 60 sma. This tells us that we maybe looking to buy.
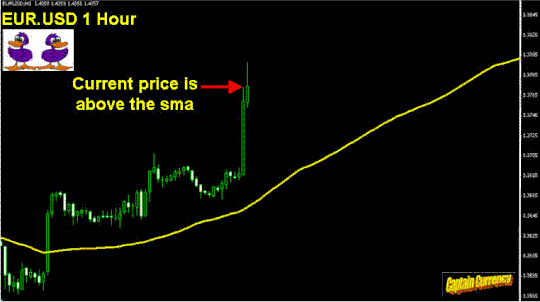
The second thing we need to do is drop down to our 1hr chart. We need to see the current price above the 60 sma on this chart also, this gives us confirmation.
Important: If the current price was to be below the 60 sma on this chart we could not move on to step 3.
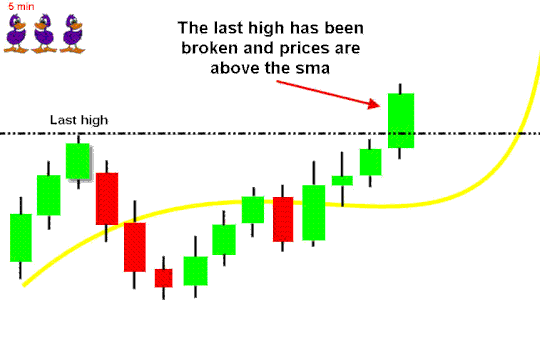
From step 1 and 2, current prices need to be above their 60 sma's on each chart. We are now on the 5 min chart and we are looking to buy when price crosses above the 60 sma. For extra confirmation we should let prices break the last high on the 5 min chart. This would mean that prices will be above their 60 sma on all 3 time-frames, therefore all 3 Ducks are lined up in the same direction.
Stop-Losses: This is where you can make this system your own. If you are a short term trader you may want to put your stop-loss below the lows on the 5 min or the 1 hr chart. If you are more of a positional trader you may wish to put your stop-loss above a low on the 4 hr chart. You could also use a fixed stop-loss, maybe 25-30 pips or more from entry. It all depends what type of a trader you are, so you decide! If you are a longer term trader or investor, this system can help you get a good entry point into the market. Another "trick" that may help you preserve capital, if you do buy and prices get back below the 5 min 60 sma by 10 pips (not a good sign) you may want to cut your losses short before your stop-loss. But if you are a longer term trader this may not be a big deal for you.
Targets: Same again, depends what type of a trader you are but target can be support or resistance levels.
Summary: The above example was carried out when the eur/usd was trading higher so obviously we where buying - the system works just as well for selling opportunities, just look for prices to be below the 60 sma on all 3 time-frames, starting with step 1 again. I like this system a lot as it does not try to out-guess the markets movements and pick tops and bottoms. The system will quickly tell you to be a buyer or a seller. It’s a good honest system that tries to follow prices. This system works better on currency pairs such as the Eur/Usd and Gbp/Usd, but there is nothing stopping you from plotting this system on any pair, but as we know some pairs act differently to others. The best time I found for trading this system is the European and US sessions. I like to use this system as a guide in addition to my own market knowledge. Take care to watch what is going on around you - economic new releases, holidays etc.
Good Luck with the 3 Duck's Trading System.
The 3 Duck’s Trading System ebook is now available. To get your free copy of the ebook, Email: [email protected] Subject: ebook

Write a comment
3Diculous (Monday, 16 September 2019 22:38)
This is pure brilliance sir.