


50# WATL Wave autotrendlines (Wati)
Watl open source, Elliott Wave Analysis, Treandline anlysis, 1-2-3 pattern
Submit by Janus Trader 27/06/2013
Wave_AutoTrendLines (WATi) is a complex technical tool which gives new technology of the price analysis.
Certainly, indicator WATi does not cancel existing positions of the classical graphic analysis, Elliott's theory and other developments in the field of the technical analysis.
Therefore, on one hand, indicator WATi is the good assistant for identification and visual definition of classical price models. On the other hand, it forms the new point of view on principles of market price behavior analysis .
Therefore, on one hand, indicator WATi is the good assistant for identification and visual definition of classical price models. On the other hand, it forms the new point of view on principles of market price behavior analysis .
During long testing, it was revealed, that indicator VATI creates own models on the price chart using semaphores and trend lines. . Many of them are components of classical price models, but some of them have unique shape, peculiar only
for this indicator. Such feature only expands practical opportunities of the indicator WATi use.
Finally, any tool of similar type is intended to help organize successful trading activity in the markets. Therefore
indicator WATi can be useful to you in following cases:
1. For visual definition of classical price models: Head -shoulders, 123 pattern, Banners, Pennants and others
2. For visual identification of «Likhovidov folding rule» price model
3. For definition of formation places and construction of WOLFE WAVES
4. For use together with B.William's system "Alligator"
5. For the simplified wave analysis and Elliot wave model identification.
Indicator WATi consists of 3 basic elements:
1. Semaphores of the High, Low and Lowest periods
The semaphores color marks by default:
The High period - red circle with 3;
The Low period - yellow circle with 2;
The Lowest period - violet points;
2. Trend lines of the High and an Low periods
Trend lines marks by default:
The High period - a red faltering line;
The Low period - a yellow continuous line;
3. The forecast trend line of the High period.
Marks of a line by default:
Pink line.
Indicator WATi trend lines assist to visually identifying «Likhovidov folding rule» price model».
Process of definition of «Likhovidov folding rule» price model consists of several stages, namely:
1. Definition of wave forms.
2. Construction of trend lines.
Trend lines should allocate and emphasize wave forms which develop the tendency movement. Horizontal movements, in
this case, do not interest us.
Indicator WATisemaphores for the simplified wave analyses
As it is already known, WATi semaphores are lit when any wave (pulse) shape is generated. Thus a semaphore
constant and not repaint.
Such feature allows to do the simplified market prices wave analysis, without deep studying a full rate of Elliott wave
analysis. In most cases, waves which were identified with indicator WATi, correctly display 5-wave model of price movement
as it is accepted according to Elliott theory. Therefore the wave analysis of the price chart by means of semaphores does not
represent the big work. It is necessary to place a digital marking of these waves only.
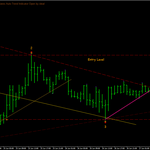
For an example we shall examine only red semaphores and we shall try to define a wave marking. On following page
photo is presented a real price chart.
As we see, indicator WATi trace all price movements and fluctuations, but marks red semaphores only for those points
which are real wave maxima and minima. The further digital marking is a several seconds work.
Similar result we shall receive, if we shall examine only yellow semaphores. In this case, yellow semaphores will
allocate wave minima and maxima of the low period.
Sommary
What is WATi:
1. Exact waves pivots for the high, low and lowest period. (red, yellow, purple colors by default) WATi draws high, low and lowest semaphores on price chart. The semaphores calculation made on the basis of the wave (pulse) formations identification. WATi does not use ZigZag or B. Williams fractals algorithms. Therefore, semaphores are stable and not repainted
2. Automatic trend lines of high and low periods. (red, yellow colors by default) After identifying waves and the semaphores formation maxima and minima points of different periods), an indicator automatically creates a trend lines on the chart for high and low periods. Trend lines are stable and not repainted. You can switch off all or part of the trendy lines creation. You can also adjust the number of lines to create.
3. The High period forecast trend line. (pink color by default) The High period forecast trend line – this is a new indicator addition indicator. This line will significantly increase your skills analysis and forecast price behavior. The forecast trend line creating has a different algorithm. The current price dynamics is used in the calculation. Trend line forecast can change its position depending on the current situation. At the same time it accurately tracks the current price behavior.
4. The warning and alarm system of events occurring Indicator has a warning and alarm system. When new high or low semaphore is formed, the indicator can notify about this textual or sound alarm

Write a comment
salil (Friday, 28 June 2013 08:17)
the semaphores give later signal.
blen (Tuesday, 27 August 2013 22:21)
cannot change the width of the major trendlines to thicker
someone (Monday, 26 October 2015 16:25)
open source??
without the source!!!!