10# Accurate Supporte and Resistance Indicator
Dimitri 2026
Support and resistance are among the most important concepts in technical trading. These are price areas where the market tends to react, reverse, or consolidate before continuing in a direction. However, identifying these zones manually can be subjective and inconsistent. The ACCURATE SR ZONES Indicator V1.0 for MetaTrader 4 was developed to automate this process and provide traders with objective, clearly defined price zones.
What Is the ACCURATE SR ZONES Indicator V1.0 MT4?
The ACCURATE SR ZONES Indicator V1.0 MT4 is a technical analysis tool designed for the MetaTrader 4 platform. It automatically detects and displays support and resistance zones based on historical price action, swing highs and lows, and reaction strength.
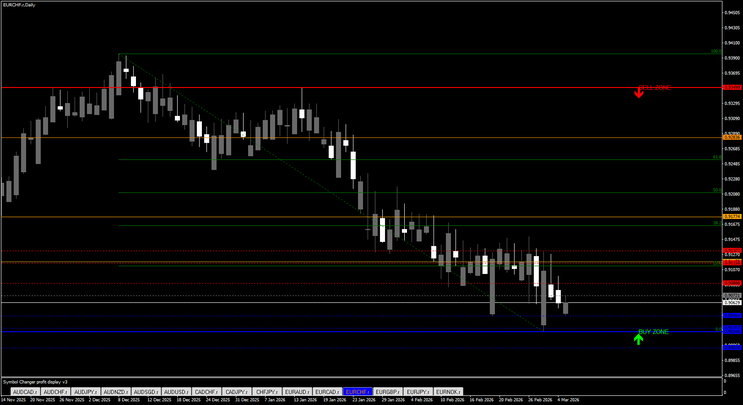
Instead of marking single price levels, the indicator highlights price areas. This is important because markets rarely react to an exact price point. They typically respond within a range, which makes zone-based analysis more realistic and practical.
How the Indicator Works
Once applied to a chart, the indicator scans historical price data to identify areas where the market has previously shown strong reactions. It analyzes swing highs and lows, repeated touches, rejection candles, and consolidation zones to determine key price areas.
When a significant level is confirmed, the indicator draws a zone with upper and lower boundaries. These zones remain stable once validated and update dynamically as new price data forms. This allows traders to see current and historically important areas without manually drawing them.
The indicator also helps traders identify role reversals. For example, when a resistance zone is broken and later retested as support, it becomes a potential continuation setup.
Key Features
The indicator provides automatic detection of support and resistance zones, eliminating the need for manual chart marking. It is compatible with multiple timeframes, from lower intraday charts to higher swing trading timeframes. The zones are structured in a way that reflects realistic market behavior rather than precise price lines.
It offers customizable settings that allow traders to adjust sensitivity, lookback period, and zone width. The indicator is lightweight and runs smoothly within MetaTrader 4 without significantly affecting performance.
Advantages
One of the main advantages is the removal of subjectivity. Traders no longer need to debate where to draw support or resistance. The indicator provides a standardized method of identifying these areas.
It also improves trade planning. Traders can use zones for entries, stop-loss placement, and take-profit targets. Breakout and retest strategies become easier to identify, especially when combined with trend analysis or momentum confirmation.
Another benefit is that it works across various market conditions and instruments, including forex pairs, indices, and commodities.
Limitations
The indicator does not execute trades automatically. It is a decision-support tool, not an expert advisor. False breakouts can still occur, especially in strong trending markets. Traders should not rely solely on the indicator and should combine it with confirmation techniques such as price action patterns or trend filters.
On lower timeframes, multiple zones may appear, which can create visual clutter if not configured properly. Beginners may also need time to learn how to interpret zone strength effectively.
Who Should Use It?
This indicator is particularly useful for price action traders who base decisions on market structure. It is also beneficial for traders who struggle with manually drawing support and resistance levels and want a more systematic approach.
Both intraday traders and swing traders can benefit from using structured zones for identifying high-probability reaction areas.
Final Verdict
The ACCURATE SR ZONES Indicator V1.0 MT4 is a practical and structured tool for identifying support and resistance areas automatically. By focusing on zones instead of precise price levels, it reflects real market behavior and helps traders plan trades with greater clarity.
When used alongside proper risk management and confirmation strategies, it can become a valuable component of a disciplined trading system.
10# SRDC Method Level II Trading System
SRDC Forex Trading Method
Linear Regression Channel Trading
Submit by janusTrader (write by Orange Roshan)
Level 2 - Part 1
Concept: As you may know, entry is upon penetration of S&R. The reasoning behind is
to simply understand one of the basics of Trader's Sentiment.
In Part 1 of Level 2 the entry is far early than this and S&R are actually T2 or Take
Profit 2.
The biggest challenge in SRDC method was to know the trend short-term and long-term.
In this level II, we will greatly improve our timing entering trades and spotting the
prevailing trend using the FX Sniper's Ergodic CCI & Trigger and Channel Trading.
Observe this chart and see whether you can SRDC Forex Trading Methodspot the dance going on inside
Indicators Used:
FX Sniper's Ergodic CCI & Trigger - settings: 2, 10, 1,2
LRC Channel
Daily Chart
1 Hour Chart
BASIC ENTRY RULE:
- Put entry following the trend shown by CCI
EXI T RULES:
Taking profit will be divided into 3. T1, T2 and T3:
- T1 can be any desired amount of pips
- T2 can be either S&R of the previous candle
- T3 Can be anything after that. Please be cautious as this carries minimal lots, say 10%
of the original lot size
How to spot the TREND
• Enable the period separator. This will draw vertical dotted line outlining a period
of 1 month in the Daily Chart and 1 week in the 1 hour chart.
• CCI - Blue on top of Red will mean BULLISH Trend and Red on top of Blue will
mean BEARISH Trend.
• LRC Channel
There will be 3 lines. The top, the median and the bottom. The candles behavior is
very predictable inside the channel. Spot the pattern!
The candles will move from MEDIAN, (TOP or BOTTOM), MEDIAN, (TOP or
BOTTOM), MEDIAN and so on.
Based on this behavior, a trader can predict which way the candles will travel tomorrow.
Let’s say, a candle is hitting the TOP trend line, there’s a great possibility that price will
move down to the MEDIAN line. When the candle is at the MEDIAN, there’s a possibility
that it will move either back to the top or go all the way to the bottom and so on...
Practice and know your pair.
Combining this information together with the FX Sniper's Ergodic CCI & Trigger will
help you to spot the prevailing trend.
STOP LOSS
A safe SL will be 50 - 60 pips on the GBPUSD. However, this can vary depending on
your trading experience.
Drawing the LRC
We use The LRC channel. This is LINEAR REGRESSION CHANNEL. This is
standard on
MT4 charts. Go to Insert>Channels> Linear Regression.
Daily:
1) According to Orange Roshan, the Big Boys draw their channels at the beginning of the
month. This means, we are in a downtrend and we have a Sell bias.
2) To properly draw the LR channel, place it on the MONTHLY divider and pull it
to YESTERDAY'S CANDLE. We use Yesterday's candle because it's a completed
candle.
3) Pull the right side of the LR channel every DAY to the new completed candle.
To do that, double click on the median line. You'll see three points. Pull the
one on the right side to the new completed candle.
4) At the beginning the month (trading days 1 and 2), since we still don't have
enough candles to draw the LR channel, we have to use the last few candles from
the previous month.
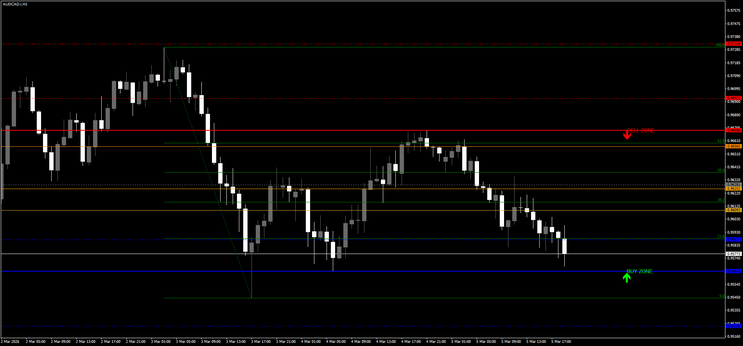
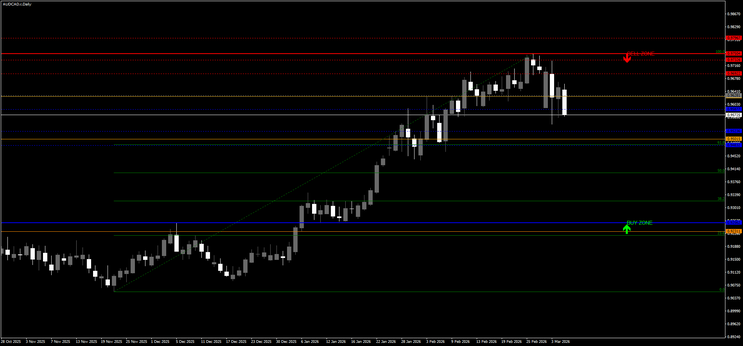
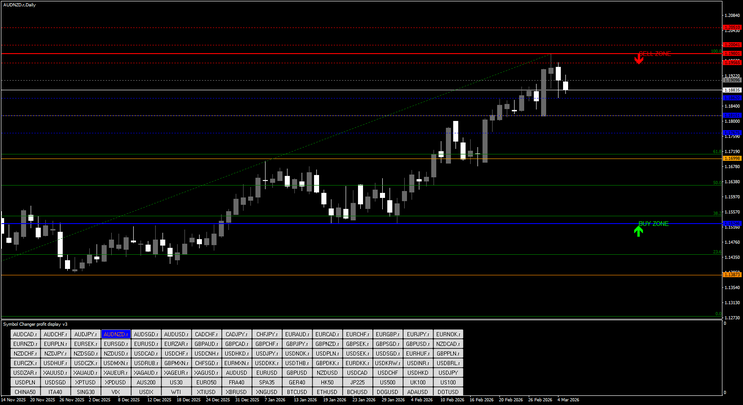
In the pictures SRDC Method Level II forex system in action.
1 Hour LRC
1) We draw it at the beginning of the week, this is Monday 00:00, and move it
accordingly every 24 HOURS. Same procedure as daily.
2) As on the daily, when starting a new week, this is early Monday, we have to
use late Friday/Sunday candles.
If for any reason (news) there's a big spike and price goes WAY BEYOND the
Channel limits, once its completed, we can re- draw the channel by pulling the right side
point of the LRC to the spike/candle. This way we are up to the hour on the newly
adjusted channel levels.