


61# Fractal Breakout
Fractal Breakout price actio strategy
Submit by Leonard 14/10/2015
Fractal Breakout is a classic price action strategy on the breakout of the high/low.
Here there is also a trend line for support. There are two free trend line indicators mql4 for metatrader 4 ( De Mark Trend line trader and Mouteki-De Mark Trend new).
The difference with other similar strategies is the introduction of a filter based on robust momentum indicators with the trend line. Specifically, the histogram of the ICC Nuf is very easy to interpret supported by the histogram filter indicator.
Time Frame 5 min or higher.
Financial Markets any.
Metatrader Indicators
Exponential moving average 11 period close,
Exponential moving average 50 period close,
CCI NUF 4,
De Mark Trend line trader,
Mouteki-De Mark Trend new,
Fractal support and Resistance,
Filter indicator with Smoothed moving average 4 period.
Rules for Fractal Breakout
Buy
EMA>EMA 50 or price above EMA 11 and EMA 50.
Buy whe the price close above the resistance of the fractal breakout indicator.
Conditions:
Breakup the trend line,
CCI Nuf histogram green color,
Filter histogram above the Moving Average
Sell
EMA<EMA 50 or price above EMA 11 and EMA 50.
Sell whe the price close below the resistance of the fractal breakout indicator.
Conditions:
Breakdown the trend line,
CCI Nuf histogram red color,
Filter histogram below the moving average.
Exit position
Place initial stop losso above/below support and resistance.
You can use the profit target of the trend line (see left corner in the window).
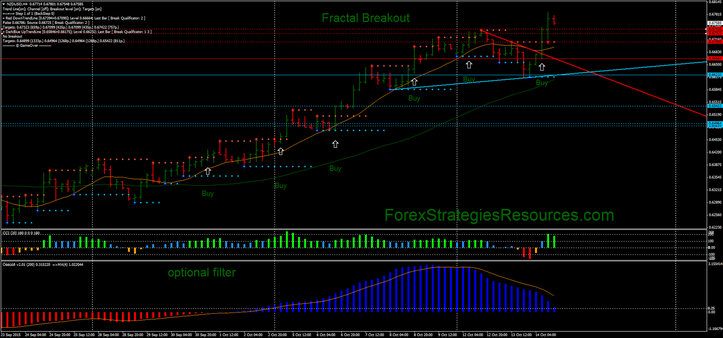
In the pictures Fractal Breakout in action.
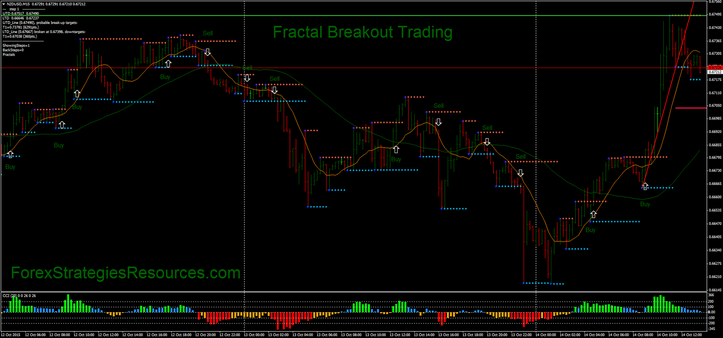
Fractal Breakout Trading System
Youtube version by Aurora
Fractal Breakout strategy is a classic price action strategy on the breakout of the high/low.
The difference with other similar strategies is the introduction of a filter based on momentum indicator the Commodity Channel Index. Furthermore, another important filter always related to the CCI is that to enter you must always wait for it to change direction first. In other words, the filter condition is that the fast CCI is greater than zero for buy or less than zero for sell but only a breakout position with a CCI cycle greater or less than zero can be taken. Then with the examples the concept is clearer. This last condition was born from experience because if on the one hand it eliminates some good signals from the other, it filters out many more negative ones, making this stratage with a more constant profitability.
Metarader Indicators
EMA 21, close. EMA 21, high – EMA 21, Low.
Fractal support and resistance
CCI NUF (fast) 14 period, close.
Tradingview indicators
EMA 21, close.
Fractal Breakout
CCI Histogram 14 periods, close, HLC3.
Other filter MA Channel 21 high, close, 21 low, close.
00
Trading rules Fractal Breakout Strategy
Buy
Price close above level of resistance,
Price close above 21 EMA or (Ema's channel)
CCI histogram >0
Sell
Price close below level of support,
Price close below 21 EMA or (Ema's channel)
CCI histogram <0
Important note
only a breakout position with a CCI cycle greater or less than zero can be taken.
For example, during a trend it is always necessary to wait for the CCI to change direction before re-entering with a breakout. This condition certainly during a trend makes us enter winning trades, but during the lateral or medium trend phases it eliminates many false signals.
Exit position
Place initial stop loss above/below support and resistance.
Profit target minimum ratio 1:1 stop loss.
Exit position when turn below/above 21 EMA


Now I am analyzing AUDNZD H1 trades
In this graph there are 4 trades.
3 buy and 1 sell.
The second and third bullish trades were validated by the condition that the CCI is back below zero.
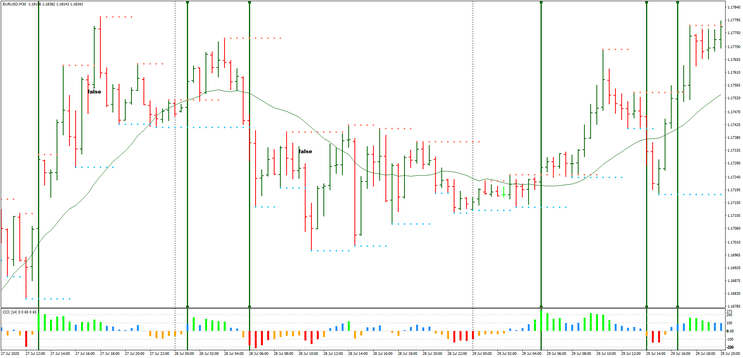
Now I analyze the trades related to the EURUSD M30 chart
here we want to show how the filter eliminates two false breakouts in which we will have lost many pips.
There are six trades on the chart, all of which are potentially positive.
But there are also two false signals eliminated by the condition on the CCI.
It can be clearly noted that the two false signals occur in the same upward cycle of the CCI.
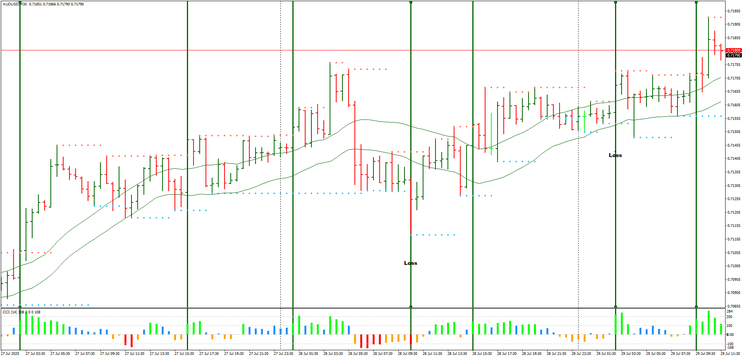
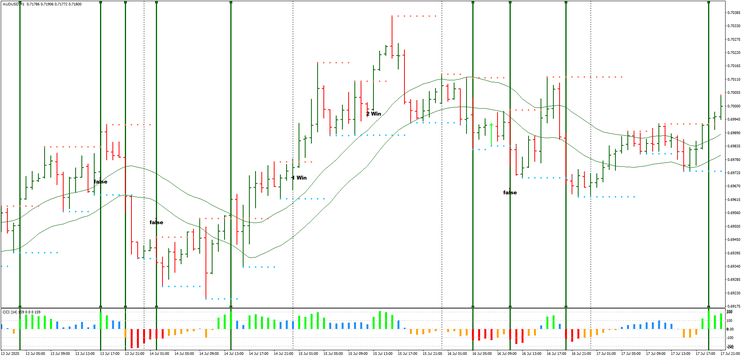
In the AUDUSD 30 min chart I added an additional filter a High / Low channel of EMA 21 then EMA 21 high and EMA 21 Low.
Here are 7 trades, 5 winners and two losers.
In the AUDUSD 60 minutes chart there are 6 trades, 4 winning and 2 losing, but there are also 3 eliminated false signals and two good eliminated signals. Also in this case, the filters introduced help the profitability to be more constant.
This constant profitability is a key to forex, the more balance there is between profits and losses the lower the drawdown tends to be and the profits constant

Write a comment
john (Wednesday, 14 October 2015 20:22)
where filter indicator?