


72# Dynamic Liquidity HeatMap Profile TradingView-MT5
Emiliano Quantitative Trader 2026
The Dynamic Liquidity HeatMap Profile is an advanced liquidity analysis tool designed to identify probable liquidity pools, stop-loss clusters, and high-interest price zones where institutional traders and market makers are likely to interact with the market.
Unlike traditional Volume Profile indicators that display only executed volume, this indicator estimates where liquidity is likely resting above and below the current market price, helping traders anticipate liquidity sweeps, stop hunts, reversals, and continuation moves.
The indicator dynamically scans recent swing highs and lows, evaluates volatility and volume behavior, and builds a visual heatmap that highlights the most attractive liquidity zones.
Understanding the Colors
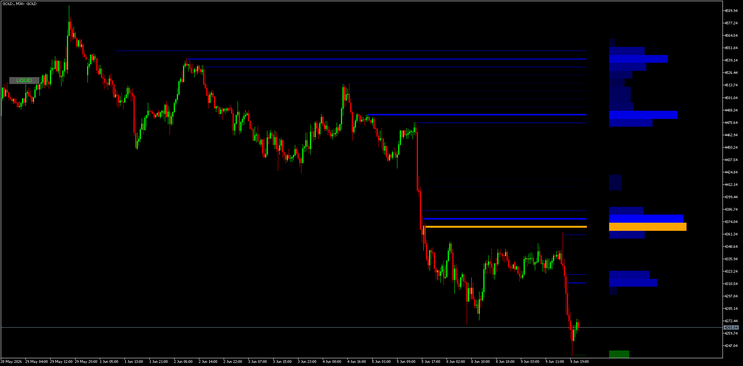
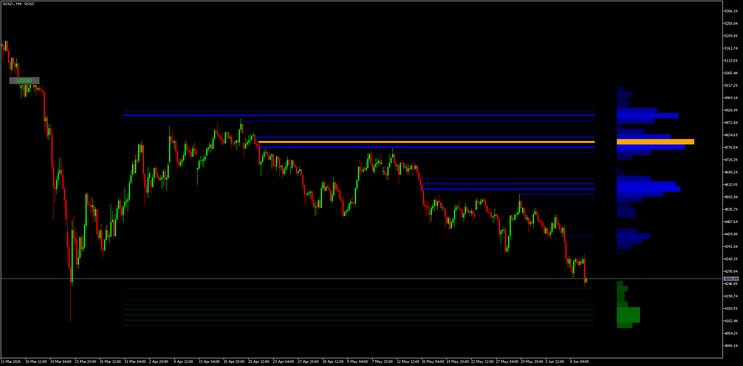
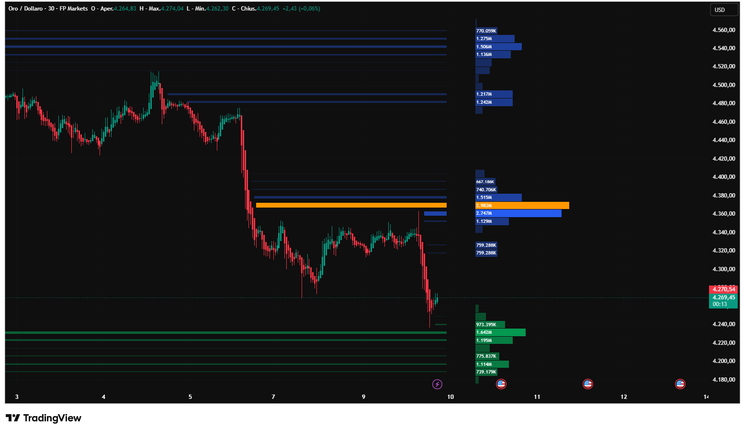
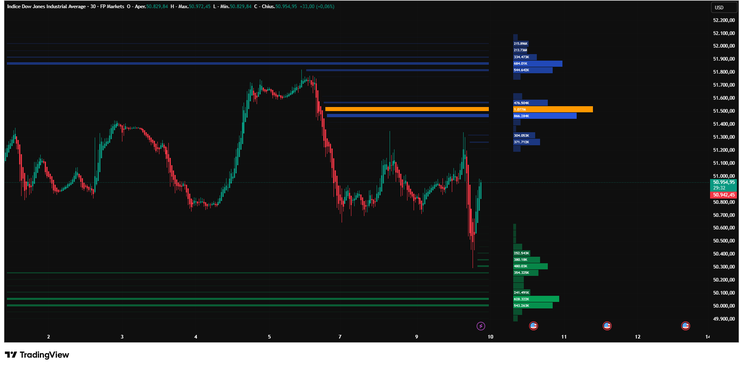
Blue Zones
Blue heatmap areas represent liquidity located above the current price.
These zones typically contain:
-
Buy-stop orders
Short position stop-losses
Breakout traders waiting to enter long
Price is often attracted toward these areas before reversing or continuing its trend.
Lime Zones
Lime heatmap areas represent liquidity located below the current price.
These zones typically contain:
-
Sell-stop orders
Long position stop-losses
Traders trapped in losing long positions
These areas frequently become targets during liquidity grabs.
Orange Zone (POC)
The orange level represents the Point of Control (POC), the area containing the highest concentration of estimated liquidity.
The POC often behaves as:
-
A liquidity magnet
A reaction zone
A potential reversal area
A target for smart-money movements
Price frequently gravitates toward this level before making its next significant move.
How to Use the Indicator
1. Liquidity Sweep Reversal Setup
One of the most powerful applications is identifying liquidity sweeps.
Bullish Reversal
Conditions:
-
Price drops into a strong lime liquidity zone.
-
A rejection wick or bullish reversal candle forms.
-
Price quickly returns above the liquidity area.
Entry:
-
Buy after confirmation candle closes.
Stop Loss:
-
Below the sweep low.
Target:
-
Orange POC.
Next blue liquidity cluster.
Bearish Reversal
Conditions:
-
Price rallies into a strong blue liquidity zone.
-
A rejection candle appears.
-
Price closes back below the liquidity area.
Entry:
-
Sell after confirmation.
Stop Loss:
-
Above the sweep high.
Target:
-
Orange POC.
Next lime liquidity cluster.
2. Trend Continuation Setup
In trending markets, liquidity zones often act as fuel for the next move.
Uptrend
Look for:
-
Market structure making higher highs and higher lows.
Liquidity building below price.
Temporary sweep of lower liquidity.
After the sweep:
-
Enter long when bullish momentum resumes.
Target
-
Upper liquidity zones.
Downtrend
Look for:
-
Lower highs and lower lows.
Liquidity building above price.
Temporary sweep of upper liquidity.
After the sweep:
-
Enter short when bearish momentum resumes.
Target:
-
Lower liquidity zones.
This behavior reflects the common institutional practice of collecting liquidity before pushing price further in the dominant trend direction.
3. Liquidity Magnet Strategy
The orange POC can be used as a target-based trading approach.
Rules:
-
When price is significantly away from the POC, expect mean reversion.
When price approaches the POC, monitor for:
-
Reversal patterns,
Breakouts,
Momentum continuation.
-
The POC frequently acts as a natural attraction point for price.

4. Breakout Confirmation
Not every breakout is genuine.
A stronger breakout usually occurs when:
-
Price sweeps a major liquidity zone.
-
The sweep is followed by strong momentum.
-
Price closes beyond the liquidity area.
This indicates liquidity has been absorbed and the path of least resistance may now be open.
Best Markets
The indicator works particularly well on:
-
Forex, Indices, Futures, Gold, Cryptocurrencies.
It can be used on any timeframe, although the most reliable signals are generally found on:
-
M15, M30, H1, H4.
Scalpers can also apply it on lower timeframes when combined with market structure and price action analysis.
Best Confirmation Tools
For higher probability setups, combine the Dynamic Liquidity HeatMap Profile with:
-
Market Structure (HH, HL, LH, LL), Break of Structure (BOS),Change of Character (CHOCH), Support and Resistance, Volume Analysis, ATR-based volatility filters,
Trend indicators.
Final Thoughts
The Dynamic Liquidity HeatMap Profile provides a unique view of hidden market liquidity by estimating where stop-loss clusters and resting orders are likely concentrated.
Rather than chasing price, traders can use the heatmap to anticipate where the market may move next, identify probable stop-hunt zones, and align their trades with institutional liquidity flows.
The most effective approach is not to trade every liquidity zone, but to wait for liquidity sweeps, confirmations, and confluence with overall market structure before entering a position.
72# Support and Resistence with Ribbon
Levels trend intraday
Ribbon with momentum
Submit Timmy
Support and Resistance whit Ribbon is an idea for intraday trading the purpose of this trading system is find the short trend with levels, ribbon and momentum. The signals that generate this system are based on complex filter systems, sometimes the senale may be late, but generally it has a good timing of entry into the market.
In other words, this system looks for the intraday market rhythms.
Time frame 15 min or 30 min.
Currency pairs Malors and Indicies.
Metatrader 4 indicators for build this template
Support and resistance proffesskional tool.
MA ribbon 55 21 moving averages.
Dibs (optional).
Exponential moving average 5 period, close.
Aweso0me oscillator defult setting.
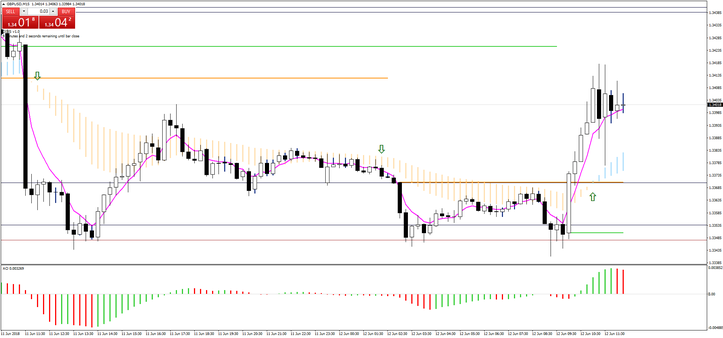
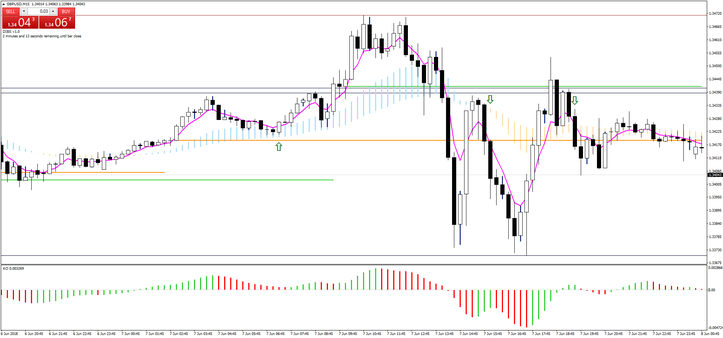
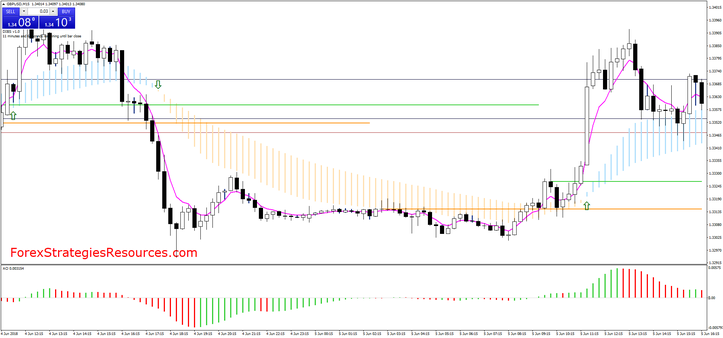
Rules Support and Resistance with Ribbon
Buy
Price above the level of Support.
Ribbon blue bar.
Awesome green bar.
Price above the exponential moving averages 5 period, close.
Profit Target 15-25 pips or at next level of SR.
Stop loss 20-25 pips.
Sell
Price below the level of Support.
Ribbon red bar.
Awesome red bar.
Price below the exponential moving averages 5 period, close.
Profit Target 15-25 pips or at next level of SR.
Stop loss 20-25 pips.
In the pictures Support and Resistence with Ribbon in action.
Share your opinion, can help everyone to understand the forex strategy.
