


79# Delta Volume Bubbles + Key Levels: A Powerful MT4 Trading Strategy
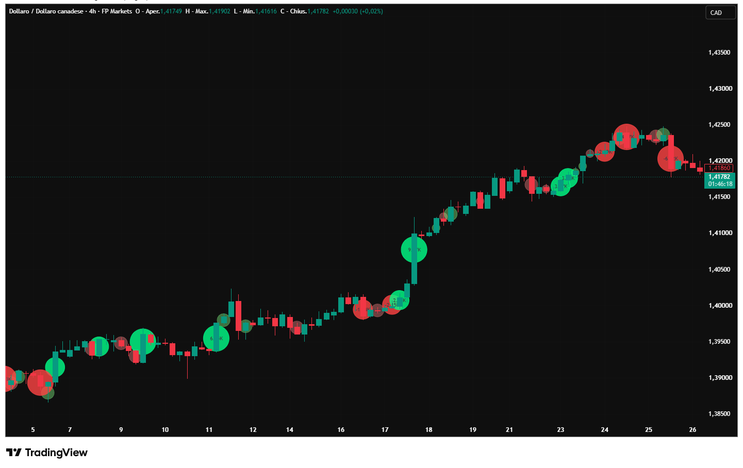
DeltaVolume Bubbles TradingView indicator.
Translate by Emiliano 2026
Delta Volume Bubbles indicator does, and when combined with key support and resistance levels, it creates a powerful trading strategy for MetaTrader 4.
In this article, we'll explore this advanced order flow tool and show you how to use it to identify high-probability trading opportunities.
What is the Delta Volume Bubbles Indicator?
The Delta Volume Bubbles is an advanced order flow visualization tool that displays buying and selling pressure through dynamic bubble representations on your chart. Unlike traditional volume indicators that only show total volume bars at the bottom of your chart, this indicator calculates the net delta volume—the difference between buying and selling volume—and presents it as color-coded bubbles of varying sizes directly on the price candles.
How It Works
The indicator uses a sophisticated approach to estimate delta volume:
-
Price Action Analysis: It analyzes the relationship between open, high, low, and close prices to determine market aggression.
-
Body Ratio Calculation: Measures the strength of price movement within each candle.
-
Aggressive Factor: Applies multipliers based on price action strength:
-
Strong moves (body ratio > 0.7): 1.5x multiplier
Moderate moves (body ratio > 0.4): 1.2x multiplier
Weak moves: 1.0x multiplier
-
-
Delta Volume Estimation: Calculates buy and sell volume based on price direction and aggressive factor.
-
Z-Score Normalization: Uses statistical z-score to make values statistically meaningful.
Visual Elements
Bubble Colors:
-
Cyan/Teal (Green tones): Bullish delta—buying pressure dominates
Pink/Magenta (Red tones): Bearish delta—selling pressure dominates
Bright colors: Aggressive buying/selling with high body ratio
Lighter colors: Moderate/passive buying or selling
Bubble Sizes: The size represents the delta strength:
-
Tiny: Delta strength < 0.3
Small: Delta strength 0.3–0.7
Normal: Delta strength 0.7–1.2
Large: Delta strength 1.2–2.0
Huge: Delta strength > 2.0
Numbers in Bubbles: The indicator displays volume values in K-notation (e.g., 25K = 25,000; 1.5M = 1,500,000) for better readability, showing the actual delta volume at that price level.
The Strategy: Delta Volume Bubbles + Key Levels
Our MT4 strategy combines the Delta Volume Bubbles indicator with key support and resistance levels to identify high-probability entry and exit points. Let's break down the components:
Strategy Components
1. Delta Volume Bubbles Indicator (MT4 Version)
-
Displays real-time buying and selling pressure.
Shows volume anomalies and institutional activity.
Visualizes aggressive market participation.
2. Key Levels
-
Red horizontal lines: Resistance levels.
Green horizontal lines: Support levels.
These levels act as decision points where price has historically reacted.
Trading Setup Rules
Long (Buy) Setup:
-
Price approaches a key support level (green horizontal line);
-
Look for bullish delta bubbles (cyan/teal colored) forming at or near the support;
-
Bubble size matters: Larger bubbles indicate stronger buying pressure;
-
Confirm with price action: Wait for bullish candlestick patterns or rejection wicks;
-
Entry: Enter long when you see aggressive buying bubbles at support.
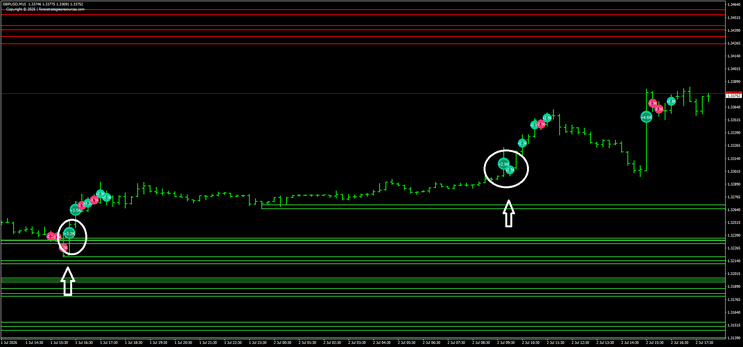
Example from charts: In the GBP/USD M15 chart, notice how bullish bubbles (cyan) formed at the green support levels (marked with white arrows), indicating strong buying interest that pushed price higher.
Short (Sell) Setup:
-
Price approaches a key resistance level (red horizontal line);
-
Look for bearish delta bubbles (pink/magenta colored) forming at or near the resistance;
-
Larger bubbles indicate stronger selling pressure and institutional distribution;
-
Confirm with price action: Look for bearish rejection patterns;
-
Entry: Enter short when aggressive selling bubbles appear at resistance.
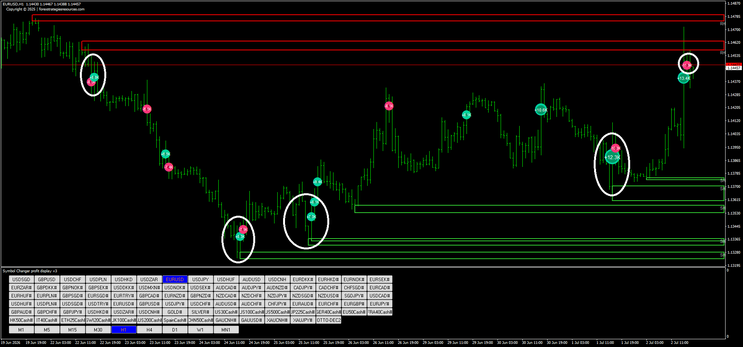
Example from charts: On the EUR/USD H1 chart, you can see pink bearish bubbles forming at red resistance levels (circled in white), signaling selling pressure that led to price declines.
Key Confluence Areas
The most powerful signals occur when multiple factors align:
Large delta bubbles (showing significant volume imbalance),
At key support/resistance levels (proven price reaction zones),
Multiple bubbles clustering at the same price level,
Opposing color bubbles disappearing (sellers exhausted at support or buyers exhausted at resistance).
Exit Strategy
Take Profit Options:
-
Next key level: Target the next support/resistance zone
-
Opposing delta bubbles: Exit when you see large bubbles of the opposite color
-
Volume climax: Huge bubbles may indicate exhaustion points
Stop Loss Placement:
-
Place stops just below support (for longs) or above resistance (for shorts),
Use the recent swing high/low as a reference,
Consider using ATR-based stops for volatility adjustment.
Real Chart Examples
Example 1: EUR/USD H1
Looking at the EUR/USD hourly chart, we can see several high-probability setups:
-
Top left circle: Bearish pink bubbles formed at a major resistance level (red line), indicating strong selling pressure. This led to a significant downward move.
Middle circles: As price declined, we saw bullish cyan bubbles at support levels, but they were overwhelmed by continued selling pressure shown by persistent pink bubbles.
Right side circle: Near the recent high, large bearish bubbles (pink, -11.9K) appeared at resistance, followed by bullish bubbles (+13.4K) showing a battle between buyers and sellers. The appearance of selling pressure at this key level suggests potential reversal.
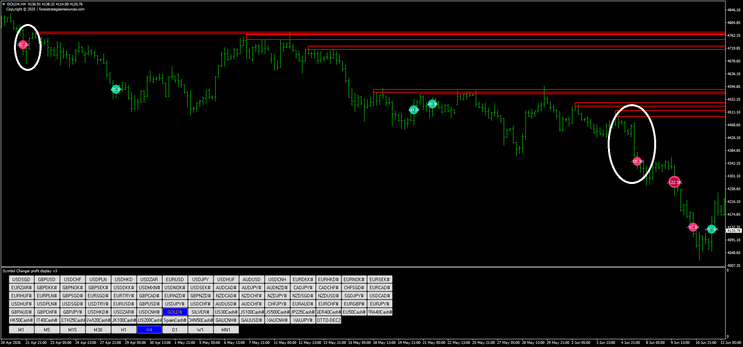
Example 2: GOLD H4
The GOLD 4-hour chart demonstrates the strategy on a higher timeframe:
-
Left circle: At the major high around 4800, we see bearish delta bubbles forming, signaling distribution and the start of a downtrend.
Middle circles: Throughout the decline, pink bearish bubbles dominated, confirming the bearish momentum.
Right circle: Near 4350–4400, we see large bearish bubbles (-12.5K, -12.8K) at support, indicating capitulation. The subsequent appearance of bullish bubbles suggests potential reversal.
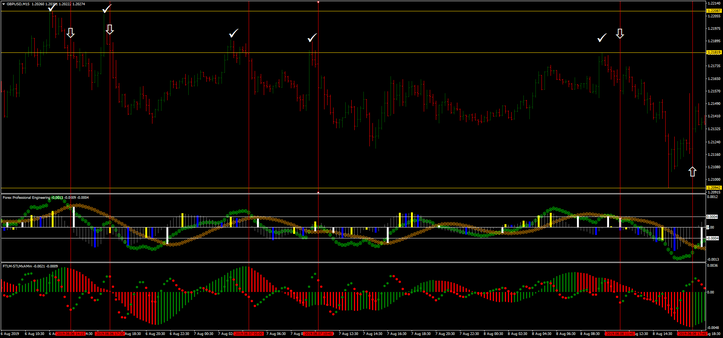
Example 3: GBP/USD M15
The 15-minute chart shows how the strategy works on lower timeframes:
-
Left arrow: Bullish cyan bubbles (+3.3K) formed at green support, leading to an upward move.
Right arrow: Another cluster of bullish bubbles (+2.9K, +3.0K) at support confirmed buying interest and continuation of the uptrend.
Recent action: At the top, we see mixed bubbles near resistance, suggesting indecision and potential consolidation.
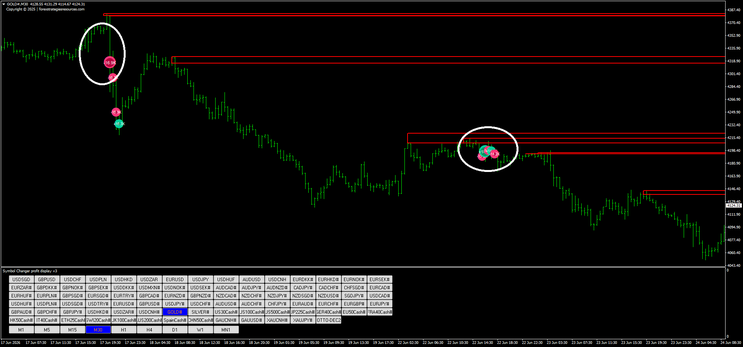
Example 4: GOLD M30
The 30-minute GOLD chart shows:
-
Left circle: Massive bearish bubbles (-16.9K) at resistance around 4350, marking a major turning point.
Right circle: Clustered bubbles (both pink and cyan) around 4200–4215 showing a battle zone where traders should watch for breakout direction.
Advantages of This Strategy
1. Visual Clarity
The bubble visualization makes it easy to instantly see where the aggressive buying or selling is occurring without needing to interpret complex charts or oscillators.
2. Real-Time Order Flow
Unlike lagging indicators, delta volume shows you what's happening right now in the market—whether institutions are buying or selling aggressively.
3. Confluence Trading
By combining volume delta with key levels, you're trading at the exact points where smart money is most active, increasing your probability of success.
4. Multi-Timeframe Application
The strategy works across all timeframes—from scalping on M15 to swing trading on H4 and daily charts.
5. Early Reversal Signals
Large delta bubbles at key levels often signal exhaustion and potential reversals before they're obvious on price alone.
Best Market Conditions
This strategy performs best in
High volume sessions: More accurate delta
calculations (London and New York overlaps for Forex).
Trending markets: Clear directional flow
identification.
Breakout scenarios: Spot aggressive buying/selling at key levels.
Support/resistance testing: Identify accumulation vs. distribution patterns.
Less effective in:
-
Low volume periods (Asian session for some pairs);
Extremely ranging markets with no clear direction;
During major news events when spreads widen significantly.
Parameter Optimization Tips
Percentile Settings
Lower percentiles (40–60%):
-
Shows more bubbles;
Good for active markets and scalping;
May generate more signals but also more noise.
Higher percentiles (70–90%):
-
Shows only the most significant bubbles;
Better for swing trading and key level analysis;
Fewer signals but higher quality.
Label Settings
-
Set label percentile 20–30% higher than bubble percentile for clarity.
Turn off labels in crowded markets to reduce visual clutter.
Enable labels at key levels for precise volume reading.
Timeframe Selection
-
M15–M30: Best for day trading and scalping.
H1–H4: Ideal for swing trading.
Daily: Good for position trading and identifying major turning points.
Risk Management
No strategy is complete without proper risk management:
-
Position Sizing: Never risk more than 1–2% of your account per trade
-
Risk-Reward Ratio: Aim for at least 1:2 or better
-
Correlation: Be aware of correlated pairs (e.g., EUR/USD and GBP/USD)
-
News Events: Avoid trading during major economic releases
-
Backtesting: Always test the strategy on historical data before going live
Limitations to Understand
While powerful, the Delta Volume Bubbles indicator has some limitations:
Estimation-based: Uses approximation
algorithms from OHLCV data, not true order flow data like futures markets provide
Volume dependency: Requires accurate volume data; works better on instruments with reliable volume
Timeframe
sensitivity: Works best on intraday timeframes with active volume
Market
hours: Most effective during high-volume trading sessions
Conclusion
The Delta Volume Bubbles + Key Levels strategy is a powerful approach to trading that combines order flow analysis with classical support and resistance trading. By visualizing where aggressive buyers and sellers are active, you gain insights into market sentiment that most retail traders miss.
Key takeaways:
Delta Volume Bubbles show you the quality
of volume, not just the quantity
Combining bubbles with key levels creates high-probability confluence zones
Large bubbles at support/resistance often signal important turning points
The strategy works across multiple timeframes and instruments
Always confirm with price action and proper risk management
Whether you're scalping the 15-minute chart or swing trading the 4-hour, this strategy gives you an edge by revealing the institutional footprint in the market. Remember, successful trading isn't just about having the right indicators—it's about understanding the story they tell and managing your risk accordingly.
Getting Started
To implement this strategy:
-
Download the Delta Volume Bubbles indicator for MT4 (the user has already converted it from TradingView)
-
Identify key support and resistance levels on your chosen timeframe
-
Apply the indicator and adjust percentile settings to your preference
-
Watch for confluence between bubbles and key levels
-
Practice on a demo account before trading live
-
Keep a trading journal to track which setups work best for you
Happy trading, and may the delta be with you!
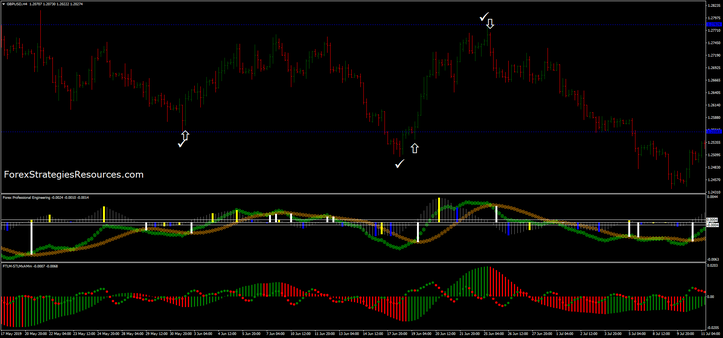
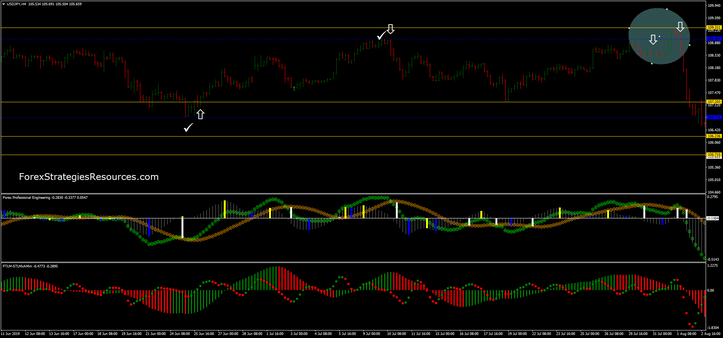
79# Forex Professional Engineering
Support and Resistance Killer strategy
True rebound strategy of price action
Submit by Janus Trader
Forex Professional Engineering is a price action strategy based on the rebound of the price on the Support and Resistance levels filterd by an advanced MACD oscillator and FTLM oscillator. The purpose of this strategy is to wait for the price to bounce on a support or resistance level but a long / short position opens in accordance with the direction of the advanced MACD and FTLM oscillator.
The purpose of this strategy is to wait for the price to bounce on a support or resistance level but a long / short position opens in accordance with the direction of the advanced MACD and FTLM oscillator. Since this strategy uses a filter, entry can also be a bit distant from support and resistance levels, but this higher risk, which assumes a greater stop loss, is rewarded by higher profitability.
Time frame 15 min or higher best time frame H1, H4, Daily, Weekly for funds management.
Currency pairs Major or minors.
Metatrader 4 indicators setting:
Support and resistances levels.
Forex Professional Engineering (120,12,26,18, 2).
FTML STLM (defaul setting).
Trading rules Forex Professional Engineering
Buy
Wait for the price to approach a support area, verify that the price bounces. Then Forex Professional Engineering green circle above than silver circle and FTML STLM with green bar.
Exit position at the next resistance or with predetermined profit target with profit ratio minimum 0.9:1 stop loss. Initial stop loss below the support level.
Sell
Wait for the price to approach a resistance area, verify that the price bounces. Then Forex Professional Engineering silver circle belove than green circle and FTML STLM with red bar.
Exit position at the next support or with predetermined profit target with profit ratio minimum 0.9:1 stop loss. Initial stop loss above the resistance level.
This is a winning strategy with a good profittability.
Aggressive mode when FTML STML changes color in the direction of the market (red down, green up). This mode can be used when learning this strategy well.
In the pictures Forex Professional Engineering in action.

Share your opinion.
