


42# Fibonacci Retracement how to use
Fibonacci Trading Method
Submit by ketang 03/02/2013
One famous method of analysis that involves Fibonacci is the Fibonacci Retracement. It is a trading strategy that uses periods of trend to find zones in which price is likely to retrace to.
For some reason, price tends to retrace to constant levels that can be calculated by theFibonacci ratios: 0.236, 0.382, 0.5 and 0.618.
These ratios serve as a potential location for price to reverse on, and for us – a good place to signal trades.
To find these levels on the chart we need to follow these simple steps:
1. Find a Trend
Find a period of strong trend.
You should find a period in which price has moved a lot in a short period of time, preferably with strong momentum.
2. Find the lowest low and highest high
Find the lowest low and highest high of the trend
In the pictures Fibonacci Retracement how to use forex system in action.
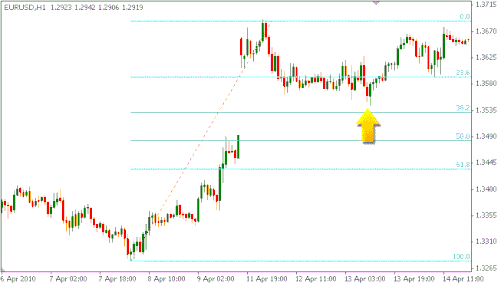
And then use the Fibonacci Retracement tool to draw the levels on the chart: And after you apply the Fibonacci Tool on the charts:
The Fibonacci retracement tool automatically draws the needed levels of the chart.
Price usually stops on these levels before continuing the trend, like in this example:
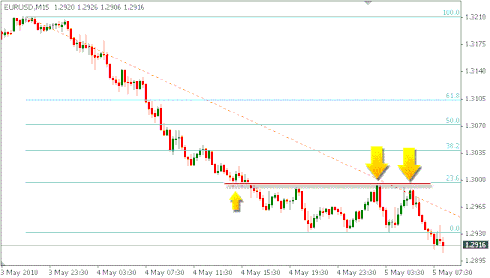
IDENTIFYING TRADING SIGNALS
The trading set-up we will trade involves price touching this Fibonacci level. We will trade only touches on the 38.2 level as it is one of the most powerful setups that generate the biggest profits.
After we have drawn the Fibonacci lines and know where the reversal levels are, it is time to signal the trade. Our primary trigger will occur when price touches the Fibonacci level of 38.2.
However, this criterion alone is not enough for signaling trade, we will require another confirmation – in the form of price-action. This will increase our hit rate and maximize our profitability.
PRICE-ACTION CONFIRMATION
To ensure that the trading signal is powerful enough and increase our win rate, we will require a confirmation from price-action and support and resistance. There are 2 kinds of confirmations we will use: support and resistance levels, and Moving Average confirmation.
A Support or Resistance confirmation means that we need to see that price has already stopped at this level in the past, so we know that this level has proof of strength and psychological importance.
If price has stopped at this level once it is far more likely that it will stop on it again, and do the retracement.
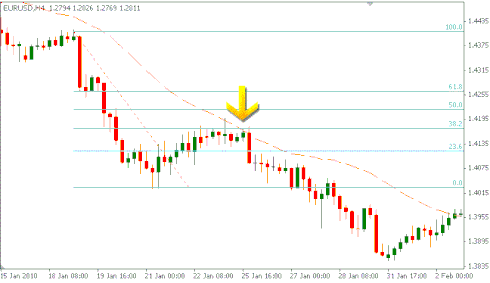
The 2nd form of confirmation is moving average confirmation. It appears when price is also touching a sloped moving average at the Fibonacci level. We will use the 20-period Simple Moving Average in our examples. Example
EXACT ENTRY TIMING
The exact entry timing is calculated using Japanese candlesticks and is designed to add one final confirmation to the system.
After we have identified the entry and confirmed it using price-action, it is time to time our entry.
A first condition is that price touches or comes very close to the Fibonacci level: After price has touched this level, we will wait for one candle in the opposite direction.
For example: for long trades we will wait for one trade to exceed the previous candle's high value. For short trades we will wait for one trade to exceed the previous candle's low value.
Stop Loss is calculated by price-action methods and depends on the volatility of the pair.
It is calculated by this method:
For Long Trades, place stop loss 5 pips below the lowest low of last 4 bars.
For Short Trades, place stop loss 5 pips above the highest high of last 4 bars.
Fibonacci Trading Systems
Fibonacci Metatrader Indicator - Forex Strategies - Forex Resources ...
13# Parabolic SAR and Fibonacci - Forex Strategies - Forex ...
6# Trend line Breakout and Fibonacci - Forex Strategies - Forex ...
12# Bollinger Bands and Fibonacci Retracement - Forex Strategies
84# 5 EMA and 13 EMA Fibonacci Numbers - Forex Strategies ...
8# Fibonacci Fan - Forex Strategies - Forex Resources - Forex ...
Fibonacci Calculator - Forex Strategies - Forex Resources - Forex ...
1# Fibonacci Retracement - Forex Strategies - Forex Resources ...
Forex books about Elliott Wawe, Fibonacci and Gann - Forex ...
45# Fibonacci System - Forex Strategies - Forex Resources -
146# Fibonacci Scalping - Forex Strategies - Forex Resources ...
23# Fibnacci Support and Resistence - Forex Strategies - Forex ...
Retracement Trading Systems
38# Kevinator Retracement - Forex Strategies - Forex Resources
88# Riding The Trend after Retracement - Forex Strategies - Forex
12# Bollinger Bands and Fibonacci Retracement - Forex
29# MACD Retracement - Forex Strategies - Forex Resources ...
43 # ForexScalp Retracement - Forex Strategies - Forex
61# The Retracement Market Method - Forex Strategies - Forex ...
1# Fibonacci Retracement - Forex Strategies - Forex Resources ...
76# EMA's Retracement - Forex Strategies - Forex Resources ...
49# CCI and Stochastic Retracement - Forex Strategies - Forex ...
39# Fibonacci Retracements, Fibonacci extensions, Fibonacci ...
13# Parabolic SAR and Fibonacci - Forex Strategies - Forex ...
82# Ema's and MACD - Forex Strategies - Forex Resources - Forex
8# Fibonacci Fan - Forex Strategies - Forex Resources - Forex ...
9# Butterly Patterns - Forex Strategies - Forex Resources - Forex ...
6# Trend line Breakout and Fibonacci - Forex Strategies - Forex ...
116# Trendline Forex Entry Signal, Two High Probability Setups
37# ADX and EMA - Forex Strategies - Forex Resources - Forex ...
