


312# Illuminations Forex MT4 Strategy — Complete Trading Guide
Maximo Trader 2026
The Illuminations Forex indicator is a dual-oscillator system built for MetaTrader 4 that combines a 100-period EMA on Typical Price with a 150-period Weighted Trend calculation. It paints the chart with four visual elements — two histograms and two arrow signals — giving traders a clear, color-coded view of trend direction and momentum.
Indicator Components
Buffer 1 - Ups (Yellow)
-
Style: Up Arrow (code 234).
Value: -1 when active.
Signal: Price BELOW EMA(100) indicating bearish momentum.
Buffer 2 - Dps (Blue)
-
Style: Histogram.
Value: -1 when active.
Signal: Price ABOVE EMA(100) indicating bullish momentum.
Buffer 3 - Mite (Red)
-
Style: Histogram.
Value: +1 when active.
Signal: Price BELOW Weighted Trend(150) confirming bearish pressure.
Buffer 4 - Meri (Lime Green)
-
Style: Down Arrow (code 233).
Value: +1 when active.
Signal: Price ABOVE Weighted Trend(150) confirming bullish pressure.
Key Levels: The indicator oscillates between -2 and +2, with the zero line acting as the neutral boundary.
The Core Logic
1. EMA Filter (Illumination = 100)
The indicator calculates an EMA(100) on Typical Price using the formula (High+Low+Close)/3.
-
When Close is greater than EMA, the Blue histogram prints below zero indicating a bullish regime
-
When Close is less than EMA, the Yellow up-arrow prints below zero indicating a bearish regime
2. Weighted Trend Filter (Illumination2 = 150)
A custom weighted calculation smooths price over 150 bars using a complex formula that gives more weight to recent prices.
-
When Close is greater than WT, the Lime down-arrow prints above zero providing bullish confirmation
-
When Close is less than WT, the Red histogram prints above zero providing bearish confirmation
Trading Rules
LONG (Buy) Setup
Entry Conditions — ALL must be true:
-
Blue histogram is visible below the zero line (Close above EMA100)
-
Lime arrow appears above the zero line (Close above WT150)
-
Both signals align on the same candle or within 1–2 candles of each other
-
Price is trading above a key horizontal support level (like the SH4 green line shown in the charts)
-
Price has broken above resistance or is bouncing from support
Entry: Buy at market on candle close confirming both conditions.
Stop Loss: Place 10-15 pips below the most recent swing low, or below the nearest support level (SH4).
Take Profit: Target the next major resistance level (RH4 red line), or use a 1:2 Risk/Reward ratio minimum.
SHORT (Sell) Setup
Entry Conditions — ALL must be true:
-
Yellow arrow is visible below the zero line (Close below EMA100)
-
Red histogram appears above the zero line (Close below WT150)
-
Both signals align on the same candle or within 1–2 candles of each other
-
Price is trading below a key horizontal resistance level (RH4 red line)
-
Price has broken below support or is rejecting from resistance
Entry: Sell at market on candle close confirming both conditions.
Stop Loss: Place 10-15 pips above the most recent swing high, or above the nearest resistance level (RH4).
Take Profit: Target the next major support level (SH4 green line), or use a 1:2 Risk/Reward ratio minimum.
Visual Analysis from AUD/JPY Charts
Looking at the AUD/JPY M15 screenshots provided:
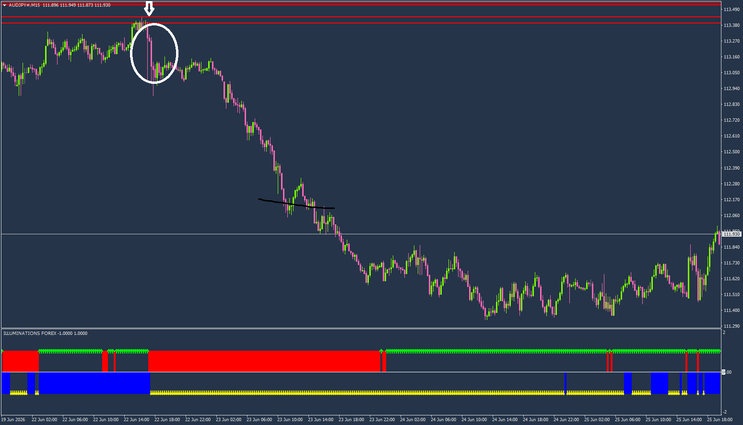
Strong Downtrend Example (June 22-23):
-
Red histogram dominated the upper window.
Yellow arrows appeared consistently below zero.
Price broke below the support level at 111.930.
This created a strong sell signal that continued for hundreds of pips down to 111.250.
Consolidation Phase (June 24-25):
-
Mixed signals with alternating red and blue histograms.
Frequent whipsaws between yellow and lime arrows.
Price moved sideways between 111.400 and 111.800.
Key lesson: Stay out during these periods; wait for clear breakouts.
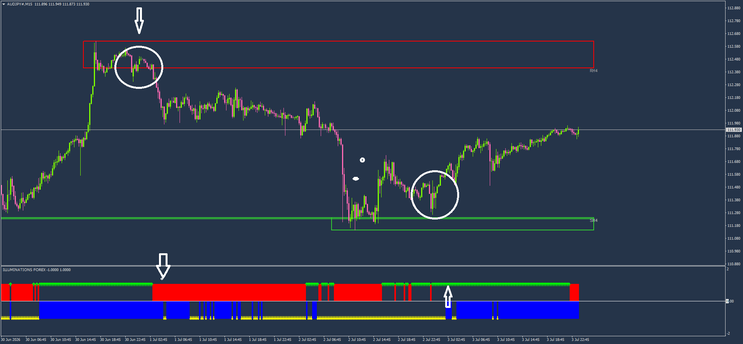
Uptrend Reversal (June 30 - July 2):
-
Blue histogram appeared strongly below zero.
Lime green arrows confirmed above zero.
Price broke above resistance at 112.410 (RH4).
Strong rally from 111.250 to 112.650.
Recent Price Action (July 3):
-
Price testing the major resistance zone around 112.580-112.680 (RH4).
-
ndicator showing mixed signals suggesting caution.
Wait for clear breakout above RH4 or rejection for next direction.
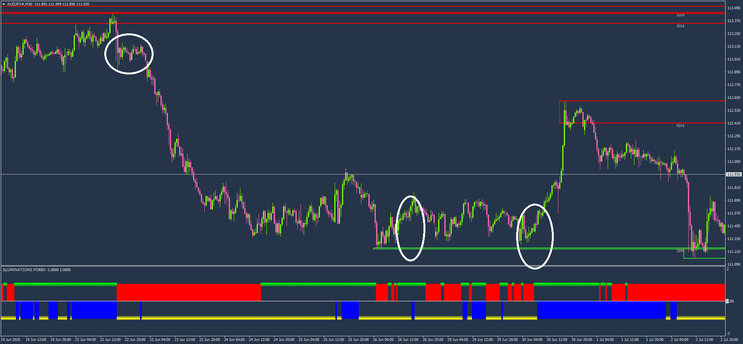
Support and Resistance Integration
The horizontal lines visible in the charts are critical for filtering signals:
Resistance Levels (RH4 - Red Lines):
-
Major resistance visible at 112.580-112.680.
Secondary resistance at 112.410.
Strong resistance cluster at 113.370-113.490.
Support Levels (SH4 - Green Lines):
-
Key support at 111.210-111.250
Minor support at 111.930 (now acting as resistance)
These levels act as profit targets and stop loss reference points
Trading Strategy with S/R:
-
Only take LONG signals when price is above support or breaking resistance
Only take SHORT signals when price is below resistance or breaking support
Avoid trading in the middle of ranges without clear S/R confluence
Risk Management Rules
Maximum risk per trade: Never risk more than 1–2% of your account balance on a single trade.
Recommended timeframe: H1 or higher is recommended. M15 can work but produces more noise and false signals.
Avoid trading during: Major news events such as NFP, RBA announcements, BOJ meetings, and FOMC decisions.
Confluence requirement: Always check the higher timeframe trend alignment. If H4 is bullish, prefer LONG signals on M15.
Trailing stop: Move stop loss to breakeven after price moves 1R (one times your risk) in your favor.
Position sizing: Calculate lot size based on stop loss distance and account risk percentage.
Advantages
Simple visual interpretation requiring no complex calculations by the trader.
Dual-filter system reduces false signals compared to single-indicator strategies.
Works exceptionally well on trending markets especially on H1, H4, and D1 timeframes.
Clear entry and exit rules with objective criteria.
Combines beautifully with horizontal support and resistance levels.
Excellent for identifying trend changes early.
Limitations
Lagging indicator because EMA(100) and WT(150) are slow, so entries come late in the move.
Whipsaws frequently in ranging markets; avoid sideways conditions.
Not suitable for scalping due to long calculation periods.
Requires manual confirmation of key support and resistance levels.
Needs additional filters during low volatility periods.
Can produce multiple false signals during news events.
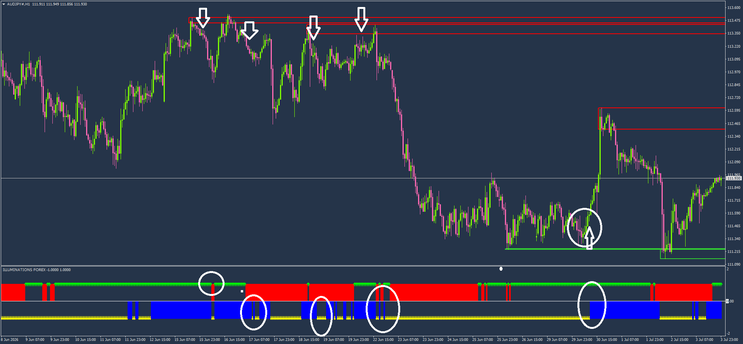
Practical Example from Charts
Trade Setup 1 - Short Opportunity (June 22):
-
Price broke below 111.930 support
Red histogram appeared strongly
Yellow arrows confirmed bearish momentum
Entry around 111.850
Stop loss above 112.000 (15 pips)
Take profit at 111.250 support (60 pips)
Risk/Reward ratio of 1:4
Trade Setup 2 - Long Opportunity (June 30 - July 2):
-
Price bounced from 111.250 support
Blue histogram appeared
Lime arrows confirmed bullish shift
Entry around 111.400
Stop loss below 111.200 (20 pips)
Take profit at 112.410 resistance (101 pips)
Risk/Reward ratio of 1:5
Final Thoughts
The Illuminations Forex indicator is best used as a trend-following confirmation tool rather than a standalone signal generator. For best results, combine it with horizontal support and resistance levels like the RH4 and SH4 lines shown in the AUD/JPY charts. Add price action analysis by looking for candlestick patterns at key levels. Always verify the higher timeframe trend direction before entering trades.
When all three elements align with the indicator's color signals, you have a high-probability setup worth trading. The key to success with this system is patience; wait for the perfect alignment of indicator signals, support/resistance levels, and price action confirmation. Avoid the temptation to trade every signal, especially during consolidation phases where the indicator will whipsaw.
Remember that no indicator is perfect, and risk management is more important than entry precision. Always use stop losses and never risk more than you can afford to lose.
312# RSX Scalping System
Rsi Timing scalping system
Submit by Janus Trader 06/04/2013
Time Frame 15 min or higher, scalping system works best all time frame.
Currecy pair any;
This Scalping System use a combination of two indicators:
RSX nrp indicator (alias RSI Timing);
Votro indicator.
HOW TO USE RSX Scalping System ?
RSX System is very simple to use. To take position:
Votro indicator gives buy signal (Signal at the bottom) and sell signal (Signal at the top)
RSX gives a confirmation of signal given by Votro indicator: BUY in return of line 20 and SELL in return to line 80
Take position = Signal of Votro+ Confirmation Signal of RSX
How to BUY using RSX Scalping System?
Choose a frame time for your trade
When Votro indicator gives a buy signal you wait for a confirmation signal of RSX indicator
You BUY When RSX returns to line 20
How to SELL using RSX Scalping System?
Choose a frame time for your trade
When Votro indicator gives a sell signal you wait for a confirmation signal of RSX indicator
You SELL When RSX returns to line 80
How to define profit Targets using RSX Scalping SYSTEM?
When you buy: 1. first profit target: when RSX reachs line 40 2. second profit target: when RSX reachs line 60 3. 3rd profit target: when RSX reachs line 80 4. last target: after line 80 in the apperance of votro signal
When you sell: 1. first profit target: when RSX reachs line 60 2. second profit target: when RSX reachs line 40 3. 3rd profit target: when RSX reachs line 20 4. last target: after line 20 in the apperance of votro signal
How define Stop loss using RSX SYSTEM:
When you sell you place your stop loss on the candle corresponding to higher value of RSX
When you buy you place your stop loss on the candle corresponding to lower value of RSX
Votro_+_2010 metatrader indicator
rsx scalping system

RSX Indicator
Advanced RSX Strategy - Forex Strategies - Forex Resources ...
RSX Metatrader Indicator - Forex Strategies - Forex Resources ...
Advanced RSX Scalping Strategy Trading System - Forex
RSX Forex Scalping - Forex Strategies - Forex Resources - Forex
278# RSX MA Full SSA Scalping System - Forex Strategies
