


313# Kaufman Adaptive Moving Average with Arrows Strategy
Maximo Trader 2026
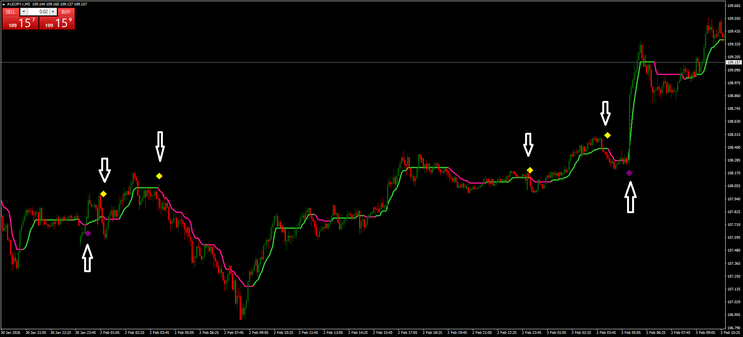
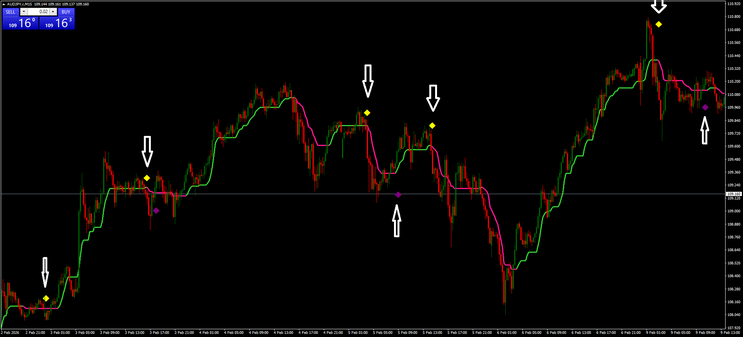
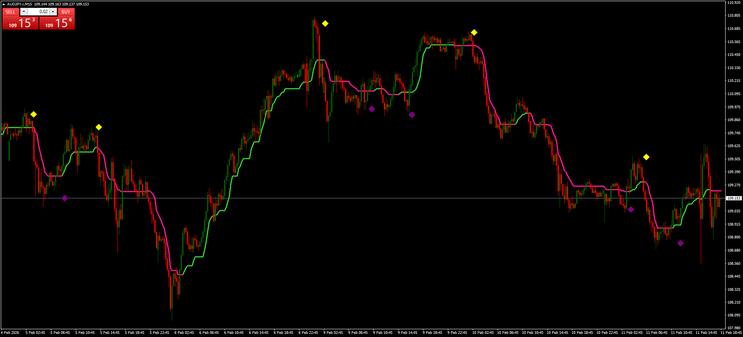
Kaufman Adaptive Moving Average with Arrows Strategy is trend following.
This trading strategy for MetaTrader 4 combines the Kaufman Adaptive Moving Average (KAMA)
with a simple arrow timing indicator.
The goal is to trade only when trend direction and entry
timing agree.
KAMA identifies the market bias and adapts to volatility: it becomes smoother during noise and faster during strong directional moves.
The arrow indicator provides visual confirmation of momentum shifts.
The system is designed for 5-minute charts or higher and can be applied to any currency pair.
Indicators Used
-
Kaufman Adaptive Moving Average – default settings
-
Green = bullish trend
Red = bearish trend
-
-
Arrows indicator – default settings
-
Green arrow = buy timing
Red arrow = sell timing
-

Chart Setup
Attach both indicators to the chart.
No additional filters are required.
Timeframe: M5 or higher.
Pairs: Any.
Trading Rules
BUY Setup
Conditions:
-
KAMA must be GREEN (uptrend).
-
A GREEN arrow must appear.
When both conditions are confirmed, open a market buy order.
You are allowed a maximum tolerance of three candles between the first
and the second signal.
If more than three candles pass, the setup becomes invalid.
Example logic:
-
Arrow first → KAMA turns green within 3 candles → Buy.
KAMA already green → arrow appears within 3 candles → Buy.
SELL Setup
Conditions:
-
KAMA must be RED (downtrend).
-
A RED arrow must appear.
When both conditions are confirmed, open a market sell order.
Again, the signals must align within a maximum of three candles.
After that, ignore the trade.
Example logic:
-
Arrow first → KAMA turns red within 3 candles → Sell.
KAMA already red → arrow appears within 3 candles → Sell.
Stop Loss & Take Profit (suggested)
The original method is flexible, but typical approaches are:
-
Stop below/above the most recent swing.
Fixed risk-to-reward such as 1:1.1 or 1:1.3.
Exit when KAMA changes color.
Traders can adapt money management to their own style.
Why the 3-Candle Rule Matters
The tolerance prevents late entries.
If confirmation comes too far from the initial signal, the move may already be extended, increasing the probability of pullbacks.
Limiting the delay keeps trades synchronized with fresh momentum.
Market Conditions
This strategy performs best in:
-
Trending or expanding volatility phases.
-
Active market sessions.
It is less effective during tight consolidations where arrows may appear frequently.
Conclusion
The KAMA + Arrows approach is a clean and mechanical way to trade with the trend while keeping entries disciplined.
By requiring:
trend agreement (KAMA color)
timing confirmation (arrow)
entry within three candles
the system filters many impulsive trades and focuses only on structured opportunities.
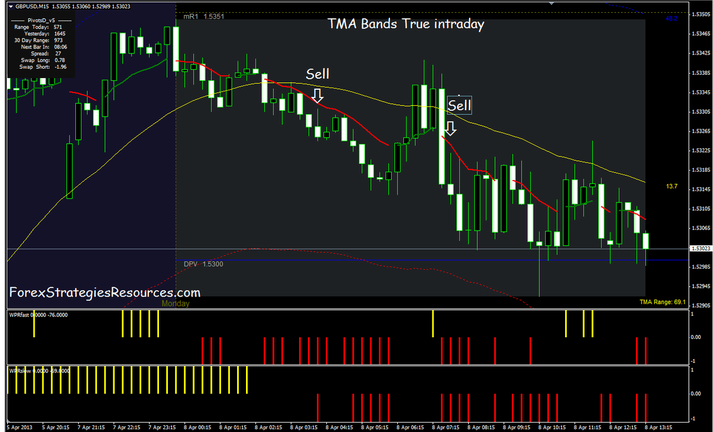
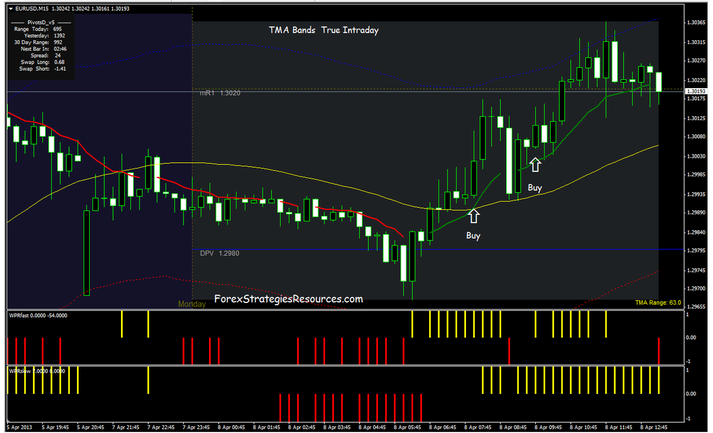
TMA Band True intraday Trading System
TMA True and WPR forex strategy
Submit by Maximo Trader 08/05/2012
Time Frame:
15 min, 30 min, 60 min.
Currency pairs:majors.
Metatrader Indicators:
Pivot levels;
color MA( 12, 1, green buy, red sell);
TMA True with distance;
WPR Fast;
WPR Low.
First step is to identify the trend. Next step is to make sure that
current wave is moving in the same direction. Only then, we can
safely open a trade.
Sell
1 – We have color ma red cross downward middle band of TMA True (yellow line);
2 – WPR Bars (low and fast) are RED
That means according to current market conditions we have a
SELL signal.
Buy
1 – We have color ma green cross upward middle band of TMA True (yellow line);
2 – WPR Bars (low and fast) are yelllow
That means according to current market conditions we have a
Buy signal.
stop loss should be 3-5 pips below/above middle band (yellow line);
Profit Target on the pivot levels or predetermined.
TMA band True intraday trading system indicators
tma true intraday template
TMA Forex Stratrgies
TMA Bands MTF Forex Trading System - Forex Strategies - Forex
Forex Scalping with TMA Bands and Keltener ... - Forex Strategies
TMA Band True (Contrarian Strategy) Trading ... - Forex Strategies
Yang Trader with TMA CG Madlen - Forex Strategies - Forex ...
294# TMA bands with Stochastic Jurik smooth - Forex Strategies
TMA Bands with RSI - Forex Strategies - Forex Resources - Forex
