


330# The Confluence Edge: Double Arrow
MaximoTrader 2026
In the world of Forex trading, relying on a single indicator is often a recipe for false signals. The key to consistent profitability lies in confluence—finding moments where multiple indicators agree on the market direction.
Today, we are breaking down a powerful, rule-based strategy using two specific custom indicators for MetaTrader 4 (MT4): Arrow1 and Darkalert. By combining these tools, we filter out market noise and catch high-probability moves on timeframes ranging from 5 minutes (M5) up to the 4-Hour (H4) chart.
Chart Setup
Before we dive into the rules, here is how you need to configure your trading environment.
-
Platform: MetaTrader 4 (MT4)
Currency Pairs: Any (The strategy works best on major pairs like EURUSD, GBPUSD, USDJPY due to liquidity, but the charts show it working effectively on EURUSD).
Time Frame: 5 Minutes (M5) or higher (M15, M30, H1, H4). Note: Higher timeframes generally yield more reliable signals.
Indicators:
-
Arrow1: This indicator plots standard Green (Up) and Red (Down) arrows to indicate short-term momentum shifts.
-
Darkalert: This indicator plots White (Up) and Magenta/Pink (Down) arrows to signal stronger trend confirmations or alerts.
-
Trading Rules: The "1-Candle Tolerance" Rule
The core of this strategy is strict timing. We do not enter a trade just because an arrow appears. We wait for confirmation.
The Golden Rule: A valid signal occurs only when both indicators (Arrow1 and Darkalert) form a signal on the same candle or within a maximum tolerance of 1 candle (i.e., the signal candle and the immediate previous or next candle).
BUY Strategy (Long Position)
We are looking for a bullish confluence where momentum and alert signals align.
-
Identify the Signal: Look for a Green Up Arrow (from Arrow1).
-
Confirm with Darkalert: Look for a White Up Arrow (from Darkalert).
-
Check Tolerance: These two arrows must appear on the exact same candle. If they are not on the same candle, they must be no more than 1 candle apart (e.g., Green arrow on candle 1, White arrow on candle 2).
-
Entry: Enter a Buy order at the open of the next candle following the confirmation.
-
Stop Loss (SL): Place your SL below the most recent swing low or below the low of the signal candle cluster.
-
Take Profit (TP): Target the next major resistance level or use a Risk:Reward ratio of 1:2.
Visual Cue from Chart: Look at the chart around 15 Jun 04:00 or 18 Jun 12:00. You see a cluster of Green and White arrows pointing up, followed by a price increase.
SELL Strategy (Short Position)
We are looking for a bearish confluence where selling pressure is confirmed.
-
Identify the Signal: Look for a Red Down Arrow (from Arrow1).
-
Confirm with Darkalert: Look for a Magenta/Pink Down Arrow (from Darkalert).
-
Check Tolerance: These two arrows must appear on the exact same candle. If not, they must be within 1 candle of each other.
-
Entry: Enter a Sell order at the open of the next candle following the confirmation.
-
Stop Loss (SL): Place your SL above the most recent swing high or above the high of the signal candle cluster.
-
Take Profit (TP): Target the next major support level or use a Risk:Reward ratio of 1:2.
Visual Cue from Chart: Look at the massive drop around 17 Jun 20:00 in the first image. Just before the crash, you see Red arrows and a Magenta arrow aligning perfectly, signaling a strong sell-off.
Conclusion
This strategy is simple but effective because it forces patience. By requiring both Arrow1 and Darkalert to agree (within a 1-candle tolerance), you avoid entering trades during choppy, sideways markets where false breakouts are common.
Pro Tip: Always check the higher timeframe trend. If the H1 chart is trending up, prioritize Buy signals on the M15 chart. If the H1 is trending down, focus on Sell signals.
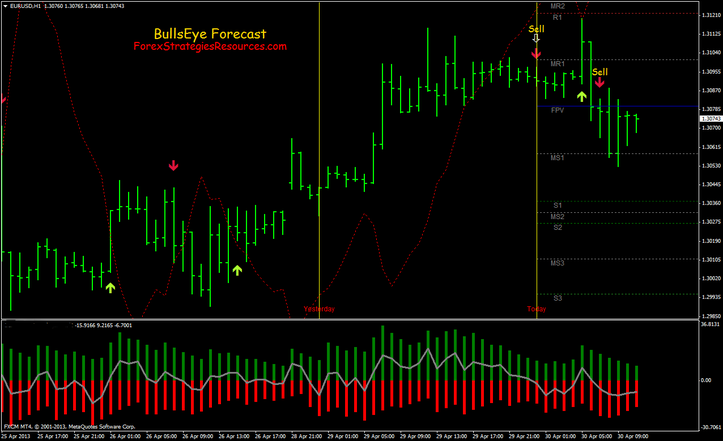
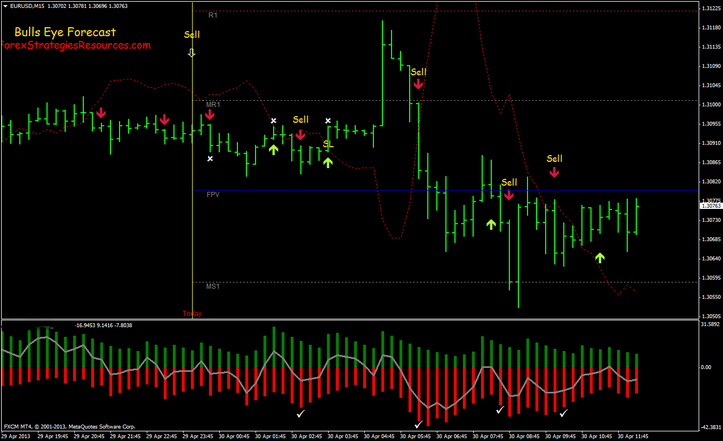
330# BullsEye Forecast
BullsEye Scalping System
BullsEye scalping system
Submit by Ketang 30/04/2013
Time Frame: 15 min 30min , 60 min.
Open EURUSD, GBPUSD or any other major currency pairs.
Bullseye scalping system metatrader indicators:
Arrow,
BullsEye Forecast,
Market Strenght
Pivot
Long Entry
We Will enter long on green arrow signal, for confirmation we will check that the average (gray Line) over market strength indicator Is trending up for last 2 bars. And the price is above BullsEye Forecast indicator.
Sell Entry
We Will enter sell on red arrow signal, for confirmation we will check that the average (gray Line) over market strength indicator Is trending down for last 2 bars. and the price is below BullsEye Forecast indicator.
Exit Position at position at opposite arrow or on the pivot levels
Stop loss onthe previous Swing
Profit target 8 -20 pips depends by currency pairs adt time frame.
In the pictures below Bullseye Forecast Scalping System in action.
Bullseye Forecast Scalping System
-
#1
yes Ketang, the signals for trade by Bullseye forecast are more clear.
