


407# EMA 96 Scalping System
The Secret of EMA 96
Submit by Buddy (written: Zidin indonesian master trader, source http://indo.mt5.com )
EMA 96 Scalping
alias The Secret of EMA 96 is a scalping strategy trend following based on 96 EMA tunnel.
Time Frame 5 min
Currency pairs: GBP/USD, EUR/USD
Forex Indicators
EMA 96 setting:
1 . Period : 96
Shift : 0
Apply to : Typical Price ( HLC / 3 ) .
Color : White
2 . Period : 96
Shift : 0
Apply to : High
Color : Light Blue
3 . Period : 96
Shift : 0
Apply to : Low
Color : Dark Blue
There are two supporting indicators , : EMA 12 and EMA 48
Setting:
Period : 12
Shift : 0
Apply to : Typical Price ( HLC / 3 ) .
Color : Yellow
And EMA 48
Period : 48
Shift : 0
Apply to : Typical Price ( HLC / 3 ) .
Color : Green.
Other Metatrader indicators:
a. Signal Bar indicator;
b . Candle time indicator;
c . ZZ Semafor
d . Breakout five panca eagle;
e . Daily open
1 . EMA 12 and EMA 48 indicates the direction ( trend ) in the short term span of 5 minutes per day ( 240 ) minutes . The intersection with the EMA 48 EMA 12 MUST BE READ . His rule was simple :
- EMA 12 ( to make it easier to remember : EMA which is smaller ) when cutting EMA 48 from above to below the mean SELL .
- When cutting from the bottom up means BUY
2 . With the help of EMA 12 and EMA 48 , that we will always do the OP - OP .
The question is : OFTEN HAPPENS , WHEN WILL intersected ( CROSS ) BETWEEN THE SECOND EMA , Intersect IT DOES NOT ALWAYS TURN FOLLOWED BY TREND ( When riding , it will continue to rise . Alternatively if dropped , then it will continue to fall ) . It often happens , it seems to happen CROSS , but it is not ! How to deal with a problem like this ?
The answer : EMA 96 that's the key ! The main function , irreplaceable , undeniable , and always occur in the forex pegerakan is FACT that :
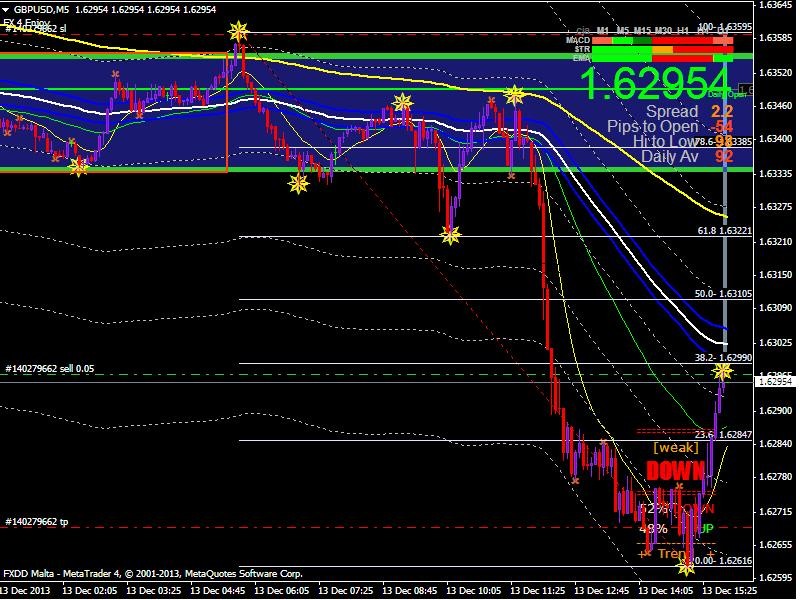
1 . When the chart is above the 96 EMA from below , then the 96 EMA line is a point of support.
2 . Conversely , if the chart penetrate from above 96 EMA , 96 EMA line then this will be its resistance point .
The functions to be memorized from the above indicators :
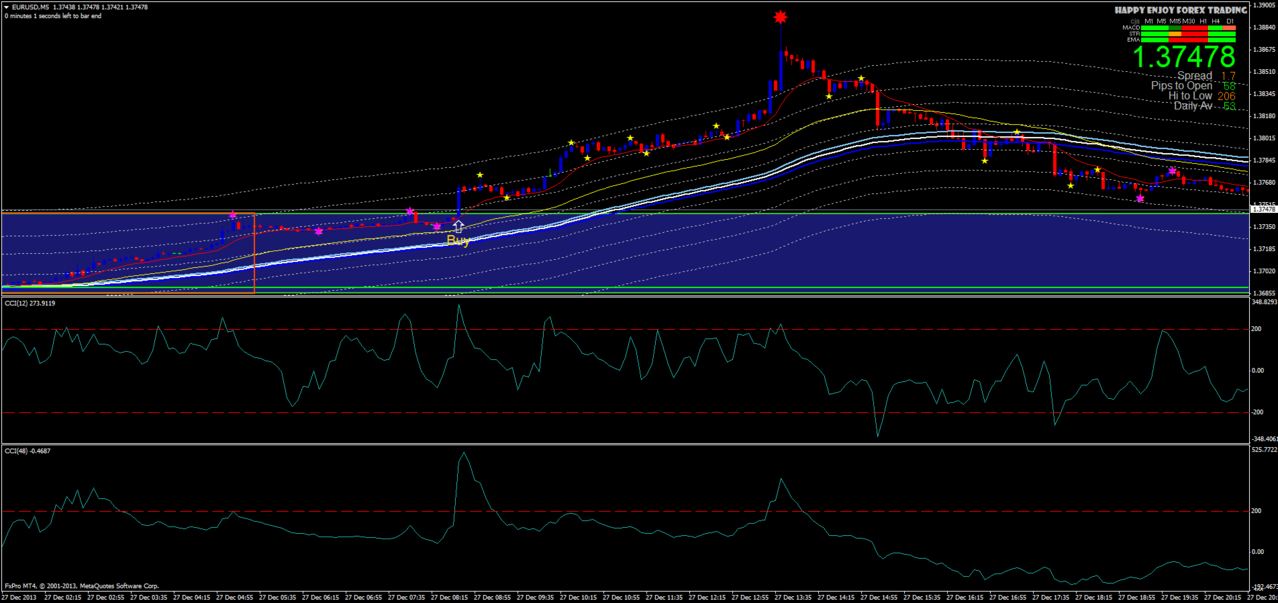
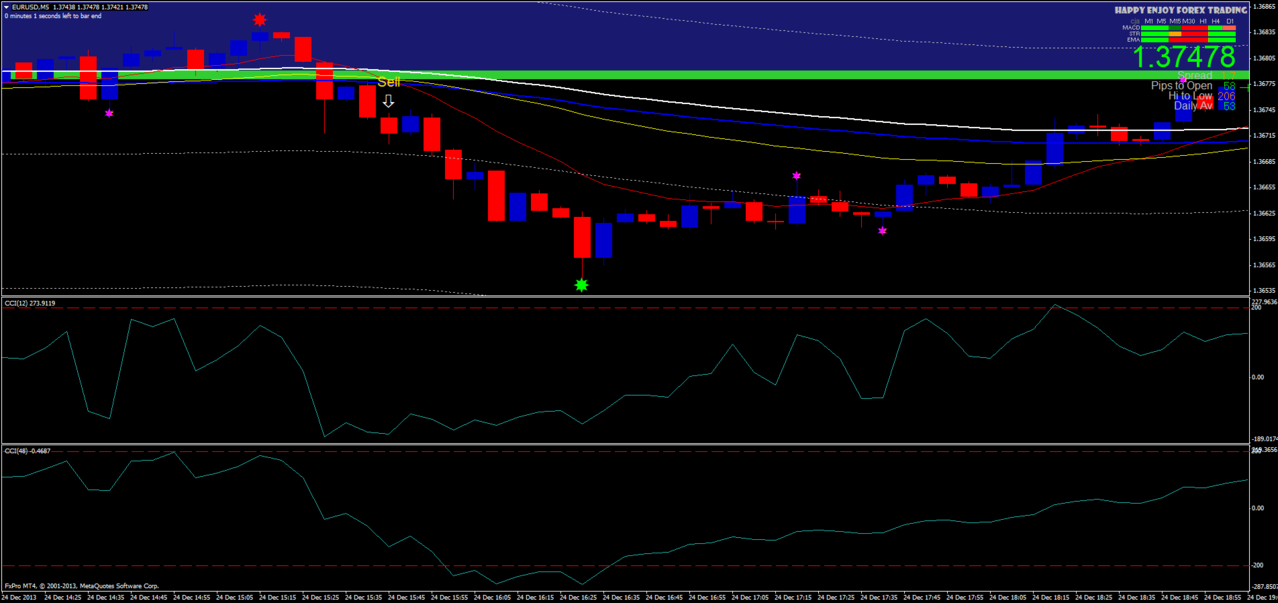
1 . 96 EMA serves as a pivot / support - resistant daily . The above chart shows the 96 EMA line region BUY ( BUY Zone ) . The chart below shows the 96 EMA line region SELL ( SELL Zone ) .
2 . EMA 12 serves as an indicator of short -term trends . The above chart shows the 12 EMA line Bullish . The chart below shows the 12 EMA Bearish
3 . EMA 48 berfngsu as a long-term trend indicator daily . The above chart shows the 48 EMA line Bullish . The chart below shows the 48 EMA Bearish
4 . The intersection ( Cross ) with EMA 48 EMA 12 shows a change in trend . EMA 12 EMA 48 cut from top to bottom = bearish . EMA 12 EMA 48 cut from the bottom up = bullish .
5 . CCI 48 shows the long- term trend toward daily ( equal to the EMA 48 ) . Note the level 0 . This is important . Level 0 = EMA 96 = point pivot / support / resistance
6 . CCI 12 ( supported by zz mmindicator zemafor or visual ) as points OP.
rules practical buy and sell
1 . Open TF M5 . Right-click , select Properties , select common , and check the box " show period separators " .
2 . Zoom out to the smallest TF M5 ( click the " zoom out " on the menu until exhausted . Then , click once the " zoom in " his .
3 . Two vertical lines that appear in the chart shows the daily period . Divided into 3 regions by making a vertical line . It serves as a handle market conditions . Remember , there are three market conditions :
- Sideways
- Bullish
- Bearish
4 . Sideways is the left-most region . This area begins at the open market until about 10/11 hrs . Properties generally sideways . In it occurs naik-turun/turun-naik chart movements are relatively small . OP can only be done once or twice only.
5 . Bullish and Bearish territory located on the second and third zones . Started after at 10/11 pm . Typically , the trend will start to seem obvious between the hours of 2:30 to 3:00 pm . When Bullish , OP Buy. Maximum breakout occurs at the level of the 576 EMA 96 . Currently , close position . Simultaneously OP SELL with profuse Lot ( certainly fit MM ) . Do the opposite if the bearish trend . At present , we can OP 5-10 x .
6 . Be careful entering the American market . When the breakout has occurred at the end of the European market , generally will be formed again a new trend . Whether it continues the trend of Europe , or the reversal of the trend . Therefore , be alert to the News USD . This is important . I do not recommend to trade at the beginning of the American session . Wait until the complete News . Or the time is pointing to the 11 - hrs late .


Write a comment