134# Market Trajectory mk1: The Ultimate Multi-Tool Indicator for TradingView
Janus Trader 2026
Market Trajectory mk1 is a sophisticated Pine Script indicator packs several institutional-grade trading tools into a single package, making it easier than ever to identify key market levels, trends, and potential reversal zones.
In this article, we'll break down what makes this indicator special and how you can use it to enhance your trading strategy.
What Does Market Trajectory mk1 Do?
Market Trajectory mk1 is not just another indicator—it's a complete trading system that combines four major analytical tools:
1. Linear Regression Channel
The foundation of this indicator is a dynamic linear regression channel that helps you identify the market's directional bias and potential breakout points.
Key Features:
- Configurable Length: Default set to 100 bars, but fully customizable,
- Deviation Bands: Set at 2.0 standard deviations by default to capture significant price movements,
- Trend Detection: Automatically identifies upward and downward trends based on slope analysis,
- Channel Break Alerts: Notifies you when price breaks out of the regression channel,
- Fibonacci Levels: Optional display of key Fibonacci retracement levels (0.236, 0.382, 0.618, 0.786).
How to Use It:
When the slope is positive and price stays within the upper channel, you're in an uptrend. Conversely, a negative slope with price in the lower channel indicates a downtrend. Breakouts from the channel often signal significant momentum shifts.
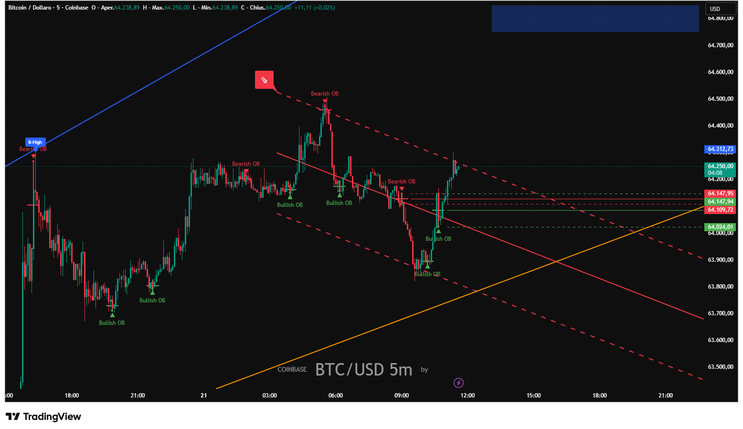
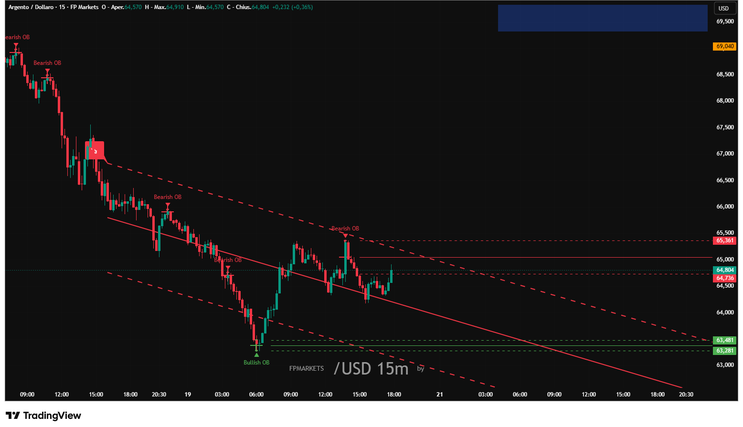
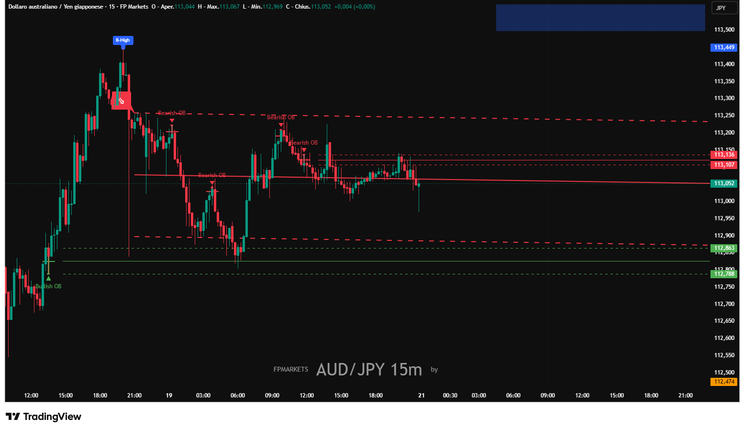
2. Order Block Detector (Bear & Bull Finder)
This is where Market Trajectory mk1 truly shines. The indicator automatically identifies institutional Order Blocks—key price zones where big players have entered the market.
Bullish Order Block:
- Identified as the last down candle before a sequence of consecutive up candles,
- Represents a demand zone where buyers stepped in aggressively,
- Marked with green/white triangles and channels.
Bearish Order Block:
- Identified as the last up candle before a sequence of consecutive down candles,
- Represents a supply zone where sellers took control,
- Marked with red/blue triangles and channels.
Customizable Parameters:
- Relevant Periods: Set how many consecutive candles are needed to confirm an order block (default: 5),
- Minimum Percent Move: Filter only significant moves (default: 0.0%),
- Wick Display: Choose whether to use full range (High/Low) or body (Open/Close) for marking zones.
Information Panel:
The indicator includes an optional info panel that displays the latest bullish and bearish order block levels (High, Average, Low), making it easy to track key zones at a glance.
3. Extrapolated Pivot Connector
This tool automatically identifies and connects significant pivot points, creating dynamic trendlines that extend into the future.
How It Works:
- Identifies Pivot Highs (labeled A-High, B-High) marked in blue,
- Identifies Pivot Lows (labeled A-Low, B-Low) marked in orange,
- Connects these pivots with extended trendlines,
- Helps visualize the market's structural direction.
Trading Application:
These trendlines act as dynamic support and resistance levels. When price approaches these lines, watch for potential reversals or breakouts.

4. Advanced Support & Resistance Zone System
This is arguably the most sophisticated component of Market Trajectory mk1. It creates dynamic zones based on pivot points and uses ATR (Average True Range) to standardize zone width across different assets and timeframes.
Zone Detection Features:
- Pivot-Based Zones: Automatically identifies swing highs and lows using configurable lookback periods,
- ATR-Based Width: Zones adjust dynamically based on market volatility,
- Zone Alignment: Overlapping zones are merged, creating stronger levels that "age" and intensify visually,
- Color Coding: Bullish zones turn green when respected, bearish zones turn yellow.
Signal Detection:
The indicator provides multiple signal types to help you catch different market scenarios:
1. Breakouts: Price breaks above all resistance pivots (blue arrow up);
2. Breakdowns: Price breaks below all support pivots (magenta arrow down);
3. Resistance Break: Price breaks above resistance (green arrow up);
4. Support Break: Price breaks below support (red arrow down);
5. False Breakdown: Price briefly breaks support before reversing up (large green arrow);
6. False Breakout: Price briefly breaks resistance before reversing down (large red arrow);
7. Support Push: Bullish candles detected within support zone (green triangle);
8. Resistance Push: Bearish candles detected within resistance zone (yellow triangle).
Customizable Settings:
- Look Left/Right: Adjust pivot detection sensitivity (default: 20/15);
- Number of Pivots: Track up to 4 key levels simultaneously;
- ATR Length & Multiplier: Fine-tune zone width (default: 30 bars, 0.5 ATR);
- Max Zone Percent: Prevent overly large zones on volatile assets (default: 5%);
- Source Selection: Choose between Heikin Ashi, High/Low Body, or standard High/Low;

Key Advantages of Market Trajectory mk1
1. All-in-One Solution
Instead of cluttering your chart with multiple indicators, you get four powerful tools in one script.
2. Institutional Concepts
The order block detection brings institutional trading concepts to retail traders, helping you identify where smart money enters the market.
3. Visual Clarity
Despite its complexity, the indicator presents information clearly with color-coded zones, arrows, and labels.
4. Alert System
Built-in alert conditions for:
- Channel breaks;
- Trend changes;
- Order block formation;
- Support/resistance breaks;
- False breakouts;
- Breakouts/breakdowns.
5. Highly Customizable
Every aspect can be tuned to match your trading style, from aggressive scalping to conservative swing trading.
How to Trade with Market Trajectory mk1
Strategy 1: Order Block Reversals
1. Wait for a Bullish or Bearish Order Block to form.
2. Mark the zone levels (High, Average, Low).
3. When price returns to the zone, look for confirmation candles.
4. Enter with stop loss below/above the order block.
5. Target the next significant level.
Strategy 2: Trend Following with Regression Channel
1. Identify the trend direction using the slope.
2. In uptrends, buy when price bounces off the middle or lower channel.
3. In downtrends, sell when price rejects from the middle or upper channel.
4. Exit when price breaks the channel in the opposite direction.
Strategy 3: Support/Resistance Zone Trading
1. Identify established zones (colored boxes).
2. Watch for "Push" signals (triangles) showing zone respect.
3. Enter on confirmation candles.
4. Use false break signals as high-probability reversal setups.
5. Trade breakouts when price decisively closes outside zones.
Strategy 4: Confluence Trading
The real power comes from combining signals:
- Order Block + Support Zone = High-probability reversal area;
- Regression Channel + Pivot Trendline = Strong dynamic support/resistance;
- False Break + Order Block = Excellent counter-trend setup.
Best Timeframes and Markets
Timeframes:
- Scalping: 5m - 15m (reduce lookback periods);
- Day Trading: 15m - 1H (default settings work well);
- Swing Trading: 4H - Daily (increase lookback periods);
Markets:
Works on any market with good liquidity:
- Forex majors and minors;
- Cryptocurrencies;
- Stocks and indices;
- Commodities.
Tips for Optimal Use
1. Don't Overtrade: Wait for high-quality setups with multiple confirmations.
2. Adjust for Volatility: Increase ATR multiplier for volatile assets.
3. Use Higher Timeframes for Direction: Check daily/4H trend before trading lower timeframes.
4. Combine with Price Action: Use candlestick patterns for entry confirmation.
5. Risk Management: Always use stop losses, especially on breakout trades.
6. Backtest: Test different settings on your preferred market before going live.
Conclusion
Market Trajectory mk1 is a professional-grade indicator that brings institutional trading concepts to your TradingView charts. By combining linear regression channels, order block detection, pivot connectors, and advanced support/resistance zones, it provides everything you need to identify high-probability trading opportunities.
Whether you're a beginner looking to understand market structure or an experienced trader seeking to streamline your analysis, this indicator offers tremendous value. The key is to understand each component, practice identifying quality setups, and develop a trading plan that incorporates these powerful tools.
Remember: No indicator is a holy grail. Success comes from proper risk management, discipline, and using these tools as part of a comprehensive trading strategy.
Have you tried Market Trajectory mk1? Share your experience and favorite setups in the comments below!
Disclaimer: This article is for educational purposes only and does not constitute financial advice. Always do your own research and trade responsibly.
134# TeKinik CRS100 Trading System
Submit by Ketang 02/06/2012
Apa itu TEKNIK CSR100?
Teknik CSR100 bermaksud Teknik "Classical Support n Resistance" dengan Target
Profit sekurang2nya 100pips (insyaALLAH) . Teknik ini based sepenuhnya pada
konsep "Support n Resistance" dan "Trade with the Trend".Teknik ini adalah teknik
klasik / teknik lama dimana tiada indicator digunakan (fibo/MA/macd/stoch/AO etc.) dan
purely based on price action.
Penggunan indicators (akan dibincangkan kemudian) mungkin akan membantu tetapi kita cuba mengelakkannya agar "ke-simple-an" teknik ini terpelihara. Lebih simple lebihbagus kan KISS - Keep it Simple n Smart.
To see PDF File.