


56# TM IFO Pro Plus: A Hybrid Flow-Based Trading Indicator for Market Regime Detection - TradingView -
Janus Trader 2026
The TM IFO Pro Plus indicator is a sophisticated, multi-layered trading system designed to capture market dynamics through a combination of momentum, volatility, and structural behavior. Unlike traditional indicators that rely on a single metric, this tool integrates RSI, MACD normalization, volatility modeling, and adaptive moving averages to create a unified framework for identifying trend, accumulation, distribution, and mean reversion phases.
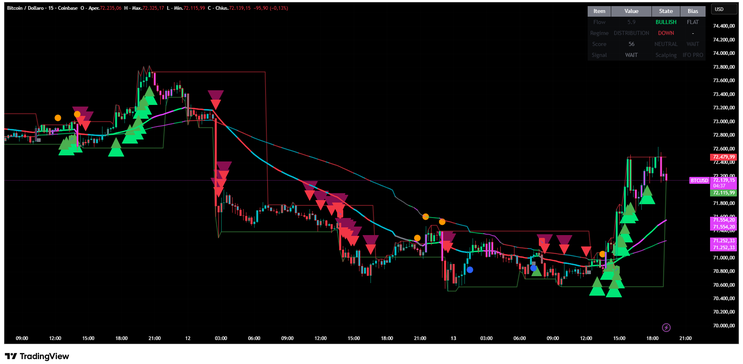
From the charts, the indicator visually translates this complex logic into an intuitive interface composed of colored trend lines, signal arrows, support and resistance zones, and a real-time analytical dashboard, making it suitable for both discretionary and semi-systematic trading.
Core Concept: The Unified Flow Engine
At the heart of the indicator lies the “flow”, a composite signal derived from a weighted combination of RSI and MACD histogram.
The RSI is centered around zero to measure directional bias, while the MACD histogram is normalized using its standard deviation to ensure consistency across different volatility regimes. These two components are blended using adjustable weights, creating a normalized momentum flow that adapts dynamically to market conditions.
This flow is then smoothed and analyzed through slope and volatility filters, allowing the system to determine whether the market is trending, compressing, or transitioning.
The result is a continuous measure of market pressure, rather than a binary signal, which significantly improves context awareness.
Market Regime Detection
One of the most advanced aspects of the indicator is its ability to classify the market into distinct regimes.
When the flow exceeds a dynamic threshold and the slope is positive, the system identifies a bullish trend. Conversely, when the flow drops below a negative threshold with a downward slope, it signals a bearish trend. Between these extremes, the indicator detects accumulation, distribution, and mean reversion phases.
This regime classification is clearly visible in the chart through color-coded price bars and moving averages, allowing traders to immediately understand the current market condition without relying on subjective interpretation.
IFMA: Adaptive Moving Average System
A key innovation in this indicator is the IFMA (Intelligent Flow Moving Average) system.
Unlike traditional moving averages with fixed parameters, IFMA dynamically adjusts its responsiveness based on the strength of the flow. When the market shows strong directional movement, the moving averages become more reactive, allowing faster trend tracking. During low volatility or consolidation phases, they smooth out to reduce noise.
The presence of both a fast and a slow IFMA creates a structure similar to a trend-following system, but with adaptive behavior that aligns with real-time market conditions.
On the chart, these lines act as dynamic support and resistance, as well as trend confirmation tools.
Signal Generation and Filtering
The indicator generates multiple types of signals, ranging from strong trend entries to more nuanced setups such as accumulation, distribution, divergence, and mean reversion opportunities.
However, what makes the system robust is the layer of filters applied before confirming signals. These include:
A VWAP filter to ensure trades align with institutional price levels
A volume filter to validate participation
A slope filter to eliminate weak momentum
Optional confirmation logic requiring multiple bars before validating a signal
This multi-filter approach significantly reduces false signals and ensures that trades are aligned with both momentum and market context.
On the charts, signals are represented through colored arrows and markers, with stronger signals appearing larger and more prominent.

Divergence and Liquidity Awareness
The indicator also incorporates divergence detection, comparing price action with the internal flow.
Bullish divergence is identified when price makes a lower low while flow shows higher lows, suggesting hidden accumulation. Bearish divergence follows the opposite logic, indicating potential distribution.
Additionally, the system implicitly captures liquidity behavior through its support and resistance plotting, which is based on flow extremes rather than simple price highs and lows. This provides a more contextual understanding of where institutional activity may occur.
Trap Detection and Market Manipulation Signals
A particularly advanced feature is the detection of bull and bear traps, based on wick analysis and flow conditions.
When the market shows strong trend signals but closes against the direction with exaggerated wicks, the indicator flags potential traps. This helps traders avoid false breakouts and recognize liquidity grabs or stop hunts, which are common in volatile markets like crypto.

Visual Interface and Decision Support
The indicator includes a real-time dashboard (HUD) that summarizes key metrics such as flow strength, market regime, score, and signal bias.
This dashboard transforms complex calculations into actionable insights, allowing traders to quickly assess whether the market is:
Trending or ranging
Bullish, bearish, or neutral
Expanding or compressing
This feature is particularly useful for intraday traders who need fast decision-making without analyzing multiple indicators separately.
Practical Application
From the charts provided, the indicator demonstrates its ability to:
Capture strong bullish impulses with clustered buy signals and rising IFMA lines
Identify distribution phases before major drops through red signals and weakening flow
Highlight consolidation zones where mean reversion dominates
React quickly to breakout movements while filtering noise
The combination of visual clarity and analytical depth makes it suitable for multiple trading styles, including scalping, intraday, and swing trading.

Strengths and Limitations
The main strength of the TM IFO Pro Plus lies in its multi-dimensional approach. By combining momentum, volatility, volume, and adaptive trend analysis, it provides a more complete picture of market behavior than traditional indicators.
It is also highly customizable, allowing traders to adjust sensitivity, filters, and confirmation rules based on their strategy.
However, due to its complexity, it requires a solid understanding of market structure and indicator interaction. Traders who rely solely on signals without understanding the underlying logic may misuse it.
Additionally, like any indicator, it performs best in markets with clear directional movement and may produce mixed signals in highly choppy conditions.
Final Thoughts
The TM IFO Pro Plus is not just a signal generator, but a comprehensive market analysis tool.
It bridges the gap between indicator-based trading and price action by translating complex market dynamics into a structured, visual format. When used correctly, it allows traders to align with trend, avoid traps, and identify high-probability opportunities with greater precision.
Ultimately, its real value lies in its ability to help traders move from reactive decision-making to a more context-driven, systematic approach to the market.

56# Skinny Dipper modified Trading System
Submit by Janus Trader 08/04/2011
Pairs: all.
Time Frame: 15 or higher.
Indicators:
50 EMA;
15 EMA;
Long and Short Setups
a) A long setup is in effect for 1 bar only when the close is above both EMA's but below the previous bar's low.
b) A short setup is in effect for 1 bar only when the close is below both EMA's but above the previous bar's high.
Long and Short Entries
a) Long entry is 2 pips above the high of the naked down-close bar ;
b) Short entry is 2 pips below the low of the naked up-close bar .
Note: reentry wait the price touches 50 EMA with (15 EMA > or <EMA 50).
Long and Short Exits
a) Exit longs at 1 point below the initial protective stop, the breakeven stop, or the trailing stop. Exit on a limit order at the profit target.
b) Exit shorts at 1 point above the initial protective stop, the breakeven stop, or the trailing stop. Exit on a limit order at the profit target.
In the pictures below Skinny Dipper modified Trading System in action.


EMA Forex Strategies
25# EMA's Band Scalp - Forex Strategies - Forex Resources -
4# Cross EMA - Forex Strategies - Forex Resources - Forex
84# 5 EMA and 13 EMA Fibonacci Numbers - Forex Strategies ...
40# MACD, RSI, 50 Ema and Pivot Points - Forex Strategies -
35# 100 EMA MultitimeFrame - Forex Strategies - Forex Resources
Ema Metatrader Indicator - Forex Strategies - Forex Resources ...
69# ADX, Parabolic Sar and three EMA - Forex Strategies - Forex
12# Ema, stochasticand RSI - Forex Strategies - Forex Resources
50# Williams % R , Stochastic and EMA - Forex Strategies - Forex
155# EMA CROSS RSI with Digital MACD - Forex Strategies -
72# EMA's, RSI and Stochastic - Forex Strategies - Forex
65# 100 'EMA and MACD “4H Strategy” - Forex Strategies - Forex
76# EMA's Retracement - Forex Strategies - Forex Resources ...
15# Ema Bands - Forex Strategies - Forex Resources - Forex ...
108# EMA's and RSI - Forex Strategies - Forex Resources - Forex
32# 4 EMA and Channel - Forex Strategies - Forex Resources ...
85# Ema's with Trading Range - Forex Strategies - Forex
126# 200 EMA Forex Strategy – - Forex Strategies - Forex ...
9# 6-12 EMA's - Forex Strategies - Forex Resources - Forex
96# EMA Cross - Forex Strategies - Forex Resources - Forex ...
6# Two Ema and MACD - Forex Strategies - Forex Resources ...
70# 3EMA'S - Forex Strategies - Forex Resources - Forex Trading
322# Channel 50 EMA two methods - Forex Strategies - Forex ...
83# 3 EMA's Forex Trading System - Forex Strategies - Forex ...
