


38# ALGO Combined by ENIGMA: A Comprehensive Analysis of TradingView’s All-in-One Indicator
Lorentz 2026
The ALGO Combined by ENIGMA is an ambitious, all-in-one technical analysis tool designed for the TradingView platform. Created to provide traders with a comprehensive market overview, it merges multiple proven strategies into a single, highly customizable overlay. By integrating trend-following algorithms, momentum oscillators, automated market structure mapping, and strict risk management protocols, this indicator aims to be the ultimate decision-support system for both novice and experienced traders.
At the heart of the indicator lies a robust trend identification engine built around a Range Filter and a Hull Moving Average suite. The Range Filter utilizes a smoothed average range calculation to filter out market noise, providing a clear visual representation of the current market direction. This is complemented by the Hull Suite, which offers three variations of the Hull Moving Average, including standard, exponential, and triangular modes. To further confirm trend strength, the indicator incorporates Dr. Alexander Elder’s Impulse System, which colors the price bars based on the alignment of an Exponential Moving Average and the MACD histogram, allowing traders to instantly gauge whether bulls or bears are in control.
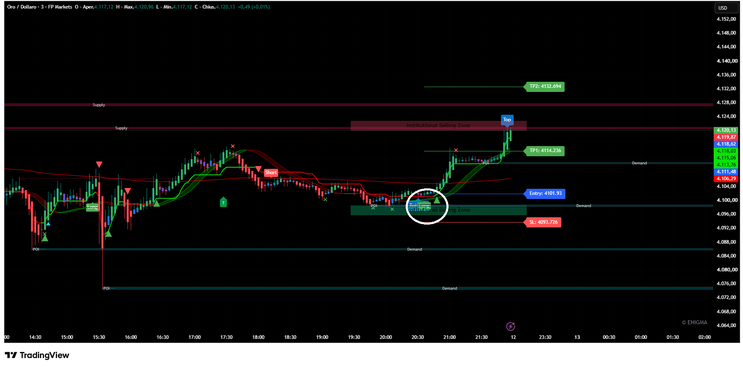
Beyond basic trend following, the ALGO Combined excels at mapping out critical market structure and liquidity zones. It features an automated Fibonacci retracement tool powered by a ZigZag algorithm, which dynamically identifies swing highs and lows to plot key retracement levels. Additionally, it supports multiple types of Pivot Points, ranging from Traditional and Fibonacci to Woodie and Camarilla, allowing traders to identify institutional support and resistance levels across various timeframes. The indicator also automatically plots Supply and Demand zones, as well as Institutional Buying and Selling Areas of Interest. These zones are calculated using swing points and Average True Range buffers, and they dynamically update to show Breaks of Structure when price invalidates a previous zone.
Trade execution and management are handled through a multi-layered signal system and built-in risk management tools. Entry signals are generated using a combination of WaveTrend oscillators, RSI divergence, and fractal patterns, ensuring that traders are only alerted when momentum aligns with price action. Once a trade is triggered, the Smart Trail feature takes over, providing an ATR-based trailing stop that integrates Fibonacci levels to help traders lock in profits while giving the trade room to breathe. Furthermore, the system includes automated Take Profit and Stop Loss levels based on percentage thresholds, complete with visual lines and alert capabilities to facilitate automated trading via webhooks.
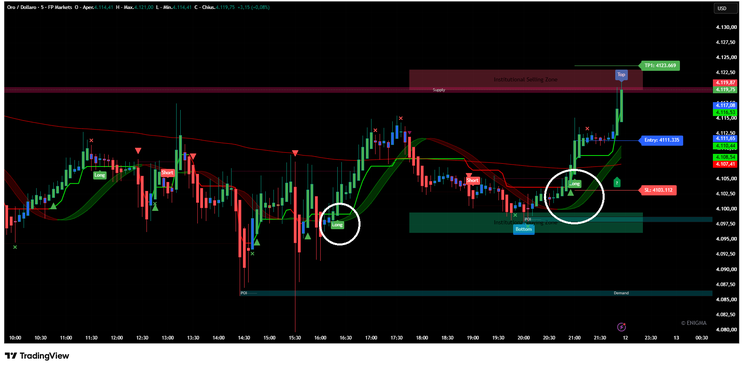
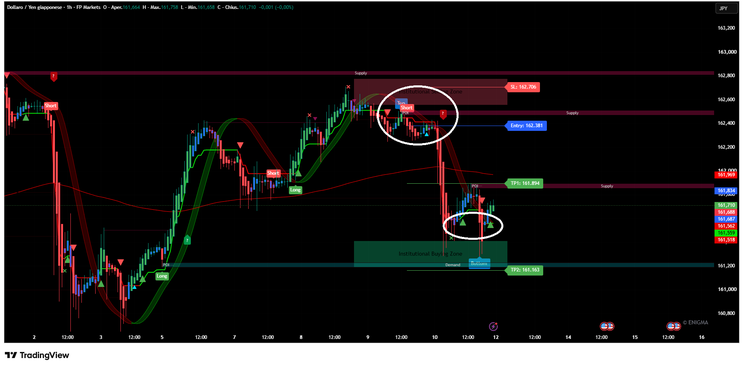
A critical aspect that users must understand about this indicator is its repainting behavior, which directly explains why traders often see multiple or shifting entries on the chart. The indicator utilizes alternate timeframe signals through TradingView's security function with the lookahead parameter explicitly enabled. This means that signals derived from higher timeframes can appear, disappear, or shift as the higher timeframe candle develops. Similarly, the automated Fibonacci and Supply/Demand zones rely on pivot detection algorithms that inherently adjust as new swing highs and lows form. However, it is important to note that the core entry and exit lines, along with the primary Range Filter and Hull MA signals, remain stable once a bar closes. Therefore, while the visual labels and zones may repaint to reflect the latest market structure, the foundational trade logic remains intact for confirmed setups.
The most automated entry and exit rules are governed by the Alternate Resolution Signal system, which evaluates moving average crossovers on a higher timeframe to prevent lower-timeframe noise from triggering false entries.
A Long Entry is triggered when the alternate resolution closing series crosses above the opening series, utilizing configurable moving averages such as ALMA, HullMA, or TEMA.
A Short Entry occurs when the closing series crosses below the opening series. Once an entry is triggered, the indicator's built-in risk management rules automatically plot the Entry, Take Profit, and Stop Loss levels. The system calculates Take Profit targets based on user-defined percentage thresholds, while the Stop Loss is dynamically placed at a fixed percentage distance from the entry price, providing a complete, automated trade management framework.
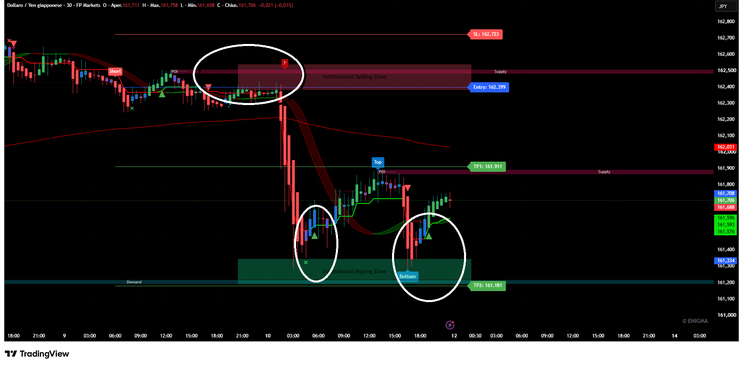
Ultimately, the ALGO Combined by ENIGMA is a powerful, feature-rich toolkit that eliminates the need to clutter a chart with dozens of separate indicators. While its sheer volume of information can be overwhelming, and its repainting elements require a disciplined approach to trade confirmation, it offers tremendous value for those who take the time to understand its mechanics. By waiting for candle closures to confirm signals and using the visual zones as a guide rather than absolute triggers, traders can effectively harness this comprehensive algorithm to navigate the financial markets with greater precision and confidence.

38# Bunny Girl Trading System
Chart Setup
· WMA 5
· WMA 20
· WMA 100
· RSI
Go Long
· WMA5 Crosses above WMA20
· WMA5 and WMA20 above WMA100
· RSI signals divergence or is above 50
Go Short
· WMA5 Crosses below WMA20
WMA5 and WMA20 below WMA100
· RSI signals divergence or is below 50
Filters
· Use a filter to eliminate frequent stops and catch the trend at the right time
· EURUSD: 25 points plus the bid/ask spread
· Other recommended pairs: 30 points plus the bid/ask spread
· These filters can and do change
· Cancel the trade if the filter price has not been reached before 5 minutes remaining on
the 30 minute bar.
· Filters on other pairs can be determined (see "Advanced Topics")
Orders
· If bull cross, place a buy stop order at the filter+spread.
· If a bear cross, place a sell stop order at the filter+spread.
· When the filter price is reached and the order engaged,
place a stop loss at about the original crossing. (Can go
as much as pips away on the other side of the crossing.)
Stop Loss
· 5 pips beyond the cross (or bounce) price
Trading Around Daily Open
· Daily Open = open price at 00:00 GMT
· Make sure there is room enough for profit targets between filter (entry) price and daily open
· If the cross is on one side of the daily open and the filter is on the other, than this is OK to trade
EXITS
Lots
· Trade multiple lots – 3 to 4.
· "Peel" out of trades. Liquidate lots as you go to lock in profits. For example, open trade with 3 lots. At first target, close 1 lot. Close another lot at second target, and the last one at the third target.
BunnyGirl's primary challenge was not entering, but exiting, the market. She openly sought advice for ways to exit the market such that she could maximize her trading profit. As a result, many exit strategies were devised and tested for and by BunnyGirl. There was no resolution.
However, the following is from one of the final posts on exits that she described (a524).
1. Trade 4 lots
2. Close the 1st lot at 10-30 pips profit, depending on the speed of the move.
3. Move a stop loss for the remaining lots to the breakeven point.
4. Close the 2nd lot at 30-50 pips.
5. Move a stop loss for the remaining lots to breakeven +10.
6. Close the 3rd lot at 50-100+ pips.
7. On the 4th lot, trail using the extreme of the previous bar, or the halfway point of the previous bar if it's longer than the average bar.
Additionally, BunnyGirl commented:
"Quite often I'll take half out at 10 - 30 pips and then trail with 3rd & 4th lot."
Also, in the case of a slow moving market :
"The first time I move stop is usually to b/e. The exception to this is if the trade is taking a long time to move and the market is flat. If I have entered and the market has not moved for some hours I will move down to a 5 mins bar to take a quicker exit rather than let it hit the initial stop."
For further information please read the attached pdf.

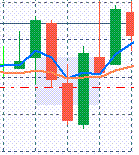
WMA5 bounces off
WMA 20 and heads up
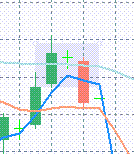
WMA5 bounces off
WMA 100 and heads
down
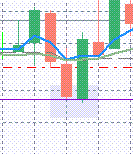
Price bounces off of
Daily open, then heads
up.
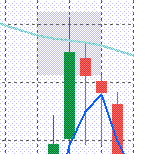
Prices bounces off of
WMA 100 then heads
sharply down. (see RSI)
Trading dengan Strategi BGX Sistem
Submit by Ketang 26/02/2012
Trading dengan Strategi BGX
Sistem
Cara trading disini menggunakan strategi BGX sytem untuk menentukan Open position dan exit .
Mata uang uang disarankan GBP/USD, EUR/USD, USD/CHF, EUR/JPY (pilih salah satu saja). Waktu trading pada saat US open (19.00 WIB) atau Europe Open (14.00 WIB)
Indikator yang
digunakan
1. Time frame grafik 30 menit Candle Stick atau Bar
2. Garis WMA 5 (warna biru) WMA 20 (Oranye) dan WMA 100 (hijau)
3. Indikator RSI 14 (default)
Untuk mensetup Indikator BGX Sistem di Platform Marketiva, setelah login melalui Streamster Anda bisa langsung mensetup indicator-indikator diatas dengan cara seperti ini:
1. Time frame 30 menit dan Candle Stick
atau Bar
Klik kanan pada bagian bidang yang menampilkan grafik (charting)Akan muncul beberapa pilihan (options). Pilihlah “Timescale” Lalu klik “30 minutes“ (30 menit) maka data grafik akan memunculkan
data harga (Open, High, Low, Close) setiap 30 menit. Klik kanan lagi bidang grafik pilih “Style”. Lalu klik "Candlesticks" atau "Bar Chart" (terserah Anda). Gambar grafik akan berubah sesuai
pilihan Anda
2. WMA 5 (Biru) dan WMA 20 (Oranye) WMA 100
(Hijau)
Klik kanan bidang grafik, maka akan muncul options. Pilih “Indicators” setelah itu pilih "Moving Average". Muncul Tab Pilihan; pada kolom "Type" pilih "Weighted"(WMA=Weightening Moving Average).
Ubahlah angka default kolom "Period" menjadi "5" lalu klik “Line Color" kotak warnanya pilih warna “Biru”. Klik "OK". Anda sekarang memiliki garis WMA 5 warna Biru. Lakukan hal yang sama untuk
membuat garis WMA 20 warna oranye dan garis WMA 100 warna hijau.
Bila sudah Anda lakukan, maka Anda sekarang memiliki 3 garis WMA yaitu WMA 5 (biru), WMA 20 (Oranye) dan WMA 100 (hijau) pada grafik harga Anda.
3. Indikator RSI
14
Klik kanan bidang grafik, akan muncul options. Pilih “Indicators” setelah itu pilih "Relative Strenght Index (RSI)" . Isi kolom "periode" dengan 14
4. Cobalah “Save” settingan Anda ini sehingga Anda tidak perlu mengatur setting-annya setiap kali login.
Untuk Men-“save” Klik kanan Bidang Grafik kemudian pilih “Save Chart “ Isi Nama file sesuai selera Anda mis; “BGX System” setelah itu klik "OK". Settingan Anda sudah tersave aman.
Untuk menghapus, mengedit mengatur dsb Anda bisa lakukan dengan cara yang sama. Tinggal klik Kanan bidang grafik (Charting).
Aplikasi BGX
System
WMA 5 (biru) untuk mengikuti harga market.
WMA 20 (oranye) untuk konfirmasi entry (OP)
WMA 100 (hijau) untuk identifikasi trend harian
Bersiap Ambil Posisi “Buy”
Bila:
WMA 5 mengcross WMA 20 dari bawah ke atas
WMA 5 dan WMA 20 berada di atas WMA 100
RSI berada di atas point 50 (garis tengah)
Entry (OP) saat harga 30 pip di atas harga cross WMA 5 dan WMA 20
Bersiap Ambil Posisi “Sell”
Bila:
WMA 5 mengcross WMA 20 dari atas ke bawah
WMA 5 dan WMA 20 berada di bawah WMA 100
RSI berada di bawah point 50. Entry (OP) saat harga 30 pip di bawah harga cross WMA 5 dan WMA 20
Target point 30 pip dan stop loss minus 5 dari persilangan (cross) WMA 5 dan WMA 20
Contoh Trading
:
Bila suatu saat WMA 5 mengcross WMA 20 dari atas ke bawah pada titik harga 1.2530 serta RSI menunjukan posisi di atas garis tengah (50). Bersiaplah mengambil posisi “BUY” pada saat harga 30 pip
di atas harga cross (1.2530 + 0.0030 (30 pip)) yaitu di 1.2560. Lalu pasang stop loss minus 5 pip di bawah garis cross (1.2530 – 0.0005) yaitu di 1.2525.
Untuk mengetahu strategy BGX system yang lebih lengkap atau strategi lainnya bisa dilihat pada ebook atau di
1#Forex Profit System - Forex Strategies - Forex Resources -
134# Forex Profit System - Forex Strategies - Forex Resources ...
91# Forex Profit System - Forex Strategies - Forex Resources ...
84# 1 min Scalping III "Profit System" - Forex Strategies - Forex ...
83# Forex Profit Monster - Forex Strategies - Forex Resources ...
11# Cornflower - Forex Strategies - Forex Resources - Forex ...
383# Forex Profit System Tea - Forex Strategies - Forex
75# Profit System - Forex Strategies - Forex Resources - Forex
38# Bunny Girl System - Forex Strategies - Forex Resources - Forex ...
130# Colt Forex System - Forex Strategies - Forex Resources ...
81# BBox Advanced Scalping System - Forex Strategies - Forex
106# Forex Perfect - Forex Strategies - Forex Resources - Forex
161# Trading System, SEFC Palato Formula Universal - Forex ...
21# Fractal and Moxo (Momentum Crossover) - Forex Strategies ...
22# Fading The Double Zero - Forex Strategies - Forex Resources
