


104# CCI Indicator with Two Moving averages
Two Day Trading Trading Systems:1) Trend Following; 2) Reveral Trading System
Submit By Kevin 09/08/2010
These area two Trading System for day trading.
CCI Indicator with Two Moving averages:
1) CCI Trend Following Trading System
Time Frame: 15 Minutes and 1 Hr whichever you prefer
Instrument : All Major Pairs
Trading Time : US Session 7:00 to 17:00 Eastern Time
Indicators: CCI 14 Period, Delete +100 and -100 Horizontal lines and add +50 Horizontal line instead.
Moving Averages : 3SMA and 9SMA
First open a 15 Minutes EUR/USD or any other chart.
HOW TO TRADE
Here is an example chart showing how the CCI Indicator with Two Moving averages System is traded. As I mentioned earlier, its a very simple and easy system to trade, we look for the CCI to cross the +50 line (marked in red) either from above or below. In the following example chart, the CCI crossed the +50 line from below ( Blue Arrow) giving us a Buy Signal and as soon as the next candle opened, we went long at 1.4926. We also got entry confirmation by the 2 SMA crossovers a little earlier. Before we start our trading in the morning, we must make a note of the time of News Releases. Once we are in the Market, we keep our eyes on any Economic Data being released that might affect our trading. You must have the webpage of www.forexfactory.com open a few minutes before the News Release by your side and keep your eyes on the numbers being released. If the numbers are favourable then stay in the Market until you get the Exit Signal. If the numbers come out against you then exit immediately and take whatever profit you already have. If you are an experienced trader then its better to reverse your trade as you will see in some of my charts later on. You can make profit both ways.
STOP LOSS
Always place your Stop Loss 2 pips above the most recent Swing High if you are Short and if you are Long then place your Stop 2 pips below the most recent Swing Low. We get our Exit signal when we see the CCI crossing the +50 line from the opposite side.
The above scenario was just a straight forward Trending Trade.
Here is another example of Trades taken during Ranging Market conditions.
When there are no news or when the Traders are undecided, the Market moves within a Range. The chart below shows that our first trade went as far as 40 pips in Profit in our favour, yet we made a loss of 2 pips brokers spread. This is because we were trading 100% mechanically. This type of situation calls for some discretion on the Traders side.
Because CCI Indicator with Two Moving averages is completely Mechanical, we missed at least 30 pips profit. This type of situations arise from time to time. Its better to use some discreetion on your part.Anyway its a good example of Reversals. We had 2 Reverse trades and each of them made in excess of 30 pips.Those of you who are experienced traders would take advantage of this type of situation.
Here is the worst scenario you can expect.
Calls for some discretion from you the Trader. The first trade went to 41 pips in Profit in our favour, yet we made only 6 pips profit trading on a Mechanical basis. When you go more than 30 pips in profit, its best to place a stop at 30 pips in Profit so that if the market retraces, you can get at least 30 pips profit and when you see the market going back where it was originaly going, you can get in the Market again and make some more profit.
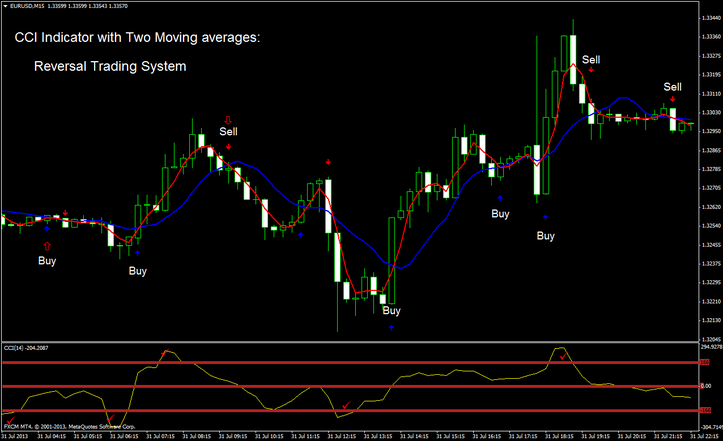
CCI Indicator with Two Moving averages: Reversal Trading System
CCI Indicator with Two Moving averages:Template and Indicators
Time Frame: 15 Minutes and 1 Hr whichever you prefer
Instrument : All Major Pairs
Trading Time : All Seesions Markets.
Indicators: CCI 14 Period, Delete +100 and -100 Horizontal lines and add +166 and -166 Horizontal line instead.
Moving Averages : 3SMA and 9SMA
Buy
When CCI indicator is below -166 wait a buy arrow and you go long position.
Sell
When CCI indicator is above -166 wait a sell arrow and you go short position.
Exit position
Always place your Stop Loss 2 pips above the most recent Swing High if you are Short and if you are Long then place your Stop 2 pips below the most recent Swing Low. We get our Exit signal or at oppsite arrow or with fast Profit Target predetermined that depends by currency pair.
CCI Indicator with Two Moving averages: Reversal Trading System. Indicators and Template.
In the pictures below CCI Indicator with Two Moving averages: Reversal Trading System in action.

CCI indicator Forex Strategies
107# CCI, MACD, Zig Zag - Forex Strategies - Forex Resources ...
49# CCI and Stochastic Retracement - Forex Strategies - Forex ...
CCI Metatrader Indicator - Forex Strategies - Forex Resources ...
10# CCI Stochastic and MACD - Forex Strategies - Forex
58# CCI Floor Forex - Forex Strategies - Forex Resources - Forex
72# CCI Explosion - Forex Strategies - Forex Resources - Forex ...
93# CCI Trend Strategy - Forex Strategies - Forex Resources -
45# CCI and EMA - Forex Strategies - Forex Resources - Forex ...
34# CCI Floor Forex II - Forex Strategies - Forex Resources - Forex
208# Gann, CCI and MACD - Forex Strategies - Forex Resources ...
356# Trading 50 cci - Forex Strategies - Forex Resources - Forex ...
248# CCI Strategy - Forex Strategies - Forex Resources - Forex ...
187# 10 pips a day with CCI and MACD - Forex Strategies - Forex
45# CCI and EMA - Forex Strategies - Forex Resources - Forex ...
211# Scalping with 200 CCI - Forex Strategies - Forex Resources ...
302# CCI 50 Strategy - Forex Strategies - Forex Resources - Forex
9# Breakout With CCI - Forex Strategies - Forex Resources - Forex
148# Fx Sniper's Ergodic CCI System - Forex Strategies - Forex ...
16# CCI System - Forex Strategies - Forex Resources - Forex ...
