


146# Mean Reversion Indicator
Channel Strategy
Submit by Dimitri (Article by Алексей Вергунов).
This post aims to show the phenomenon of mean reversion, understood as the tendency of the prices of a financial instrument to be "attracted" towards their long-term average value, presenting a behavior in disagreement, once again with the theory of 'efficiency. In practice, for some assets, as well as for interest rates and perhaps even exchange rates, it appears that the Brownian geometric motion (GBM), also known as the Wiener process, which is referred to as a stochastic process model representative of trends subject to multiple shocks, is replaceable with a "mean-reverting" model.
The article by Алексей Вергунов is proposed in this regard because it makes a reference to an MT4 indicator that can be used by everyone.
“Support and resistance levels”, which are an excellent technical analysis tool. However, it is sometimes difficult to determine whether the breakdown has actually occurred or whether the price simply tests the level. The Mean Reversion Indicator helps to determine false breakdowns by increasing the quality of the analysis.
As you know, the price has the ability to always return to the average. The indicator exploits this function using a mathematical approach that is not entirely standard. It is based on regression analysis, and in particular on polynomial regression, on the basis of which the so-called "center of gravity" of the price is formed. The indicator allows you to determine with a sufficient degree of probability whether the price breaks through the support/resistance level, continuing to move in the expected direction or will move away from it.
Characteristics of the indicator Mean Reversion
Platform: MetaTrader.
Currency pairs: any.
Time frame: any.
Description
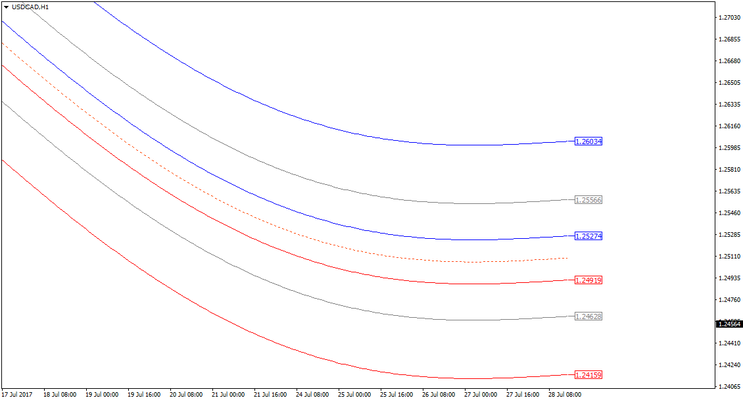
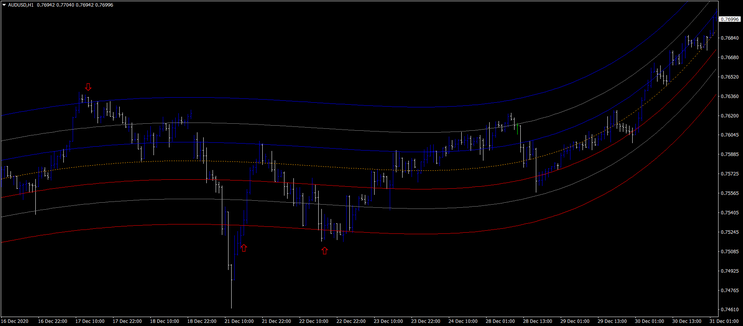
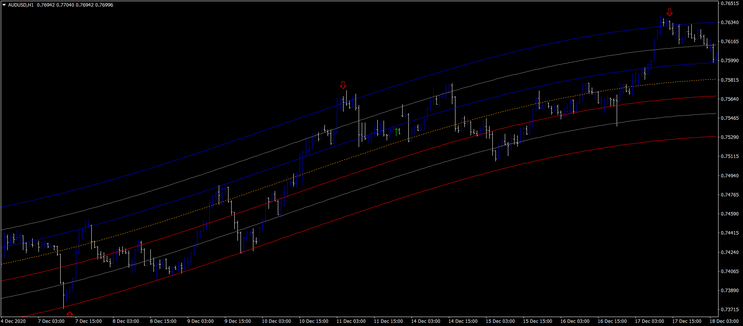
The indicator is set up according to the standard instructions and is a price channel consisting of 7 lines. The bar line in the center is called the "center of gravity". In reality, all other lines are calculated based on one standard deviation from the central one. The channel has overbought and oversold zones located between the gray and extreme lines of the channel. It is worth paying special attention to these two areas.
The indicator settings include 4 points:
Enable or disable the price tags on the right side of the chart;
Number of bars to calculate;
The standard deviation factor affects the flow of all lines;
Relative position of center lines (gray) - accepts values from 0 to
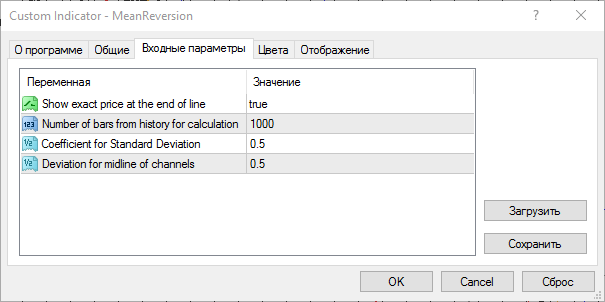
Important: adjust the parameters to the volatility of the instrument, so that the price is most of the time inside the channel. See the video below.
How to Use The Mean Reversion indicator
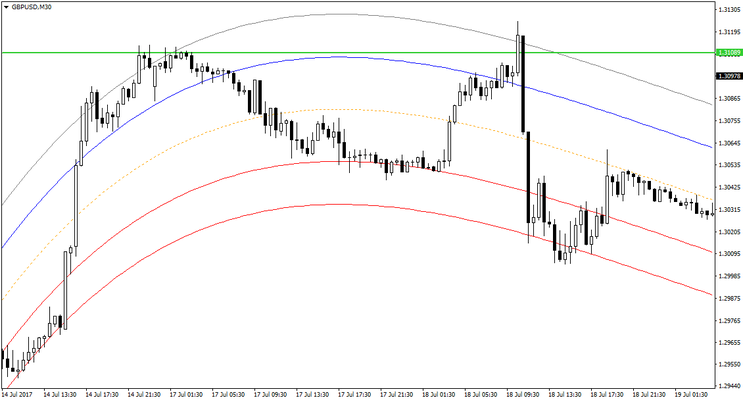
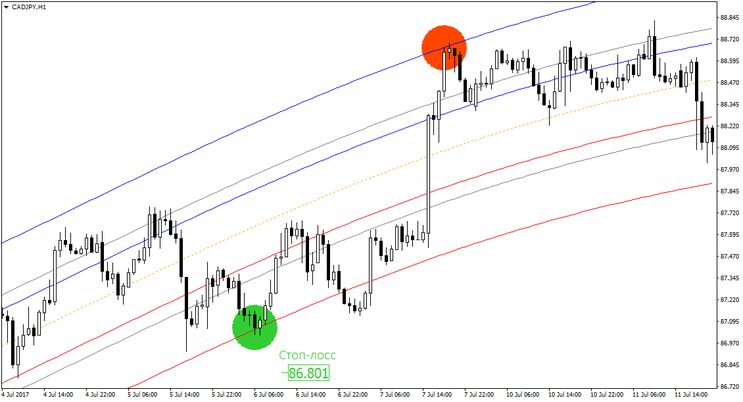
The Mean Reversion indicator draws a channel that identifies the extreme zones for the price. The extreme lines of the channel define the overbought and oversold zone. In this case, the price touches the upper line, which is a strong sign of buyer exhaustion - the market simply cannot cope with the pressure.
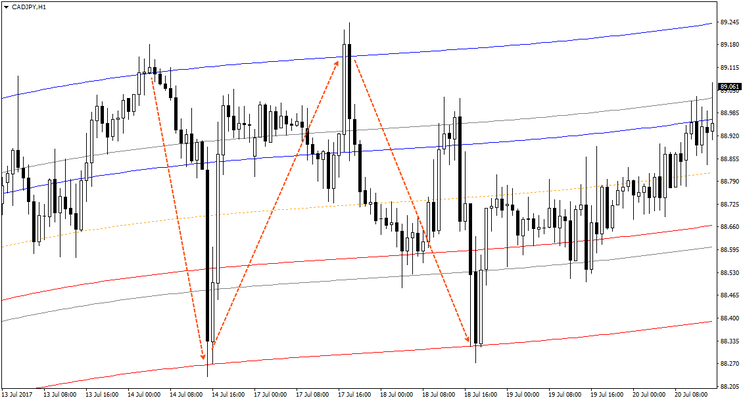
Another way to use the indicator is to determine the exit point from the location. Let's say you have opened a sales order following a downtrend. The task is to determine when the trend will end and the price will turn in the opposite direction. A fairly reliable signal is the price exit in the oversold zone - hitting the lower limit of the channel. This means that the market is running out, there will most likely be a rebound and it is time to lock in profits.
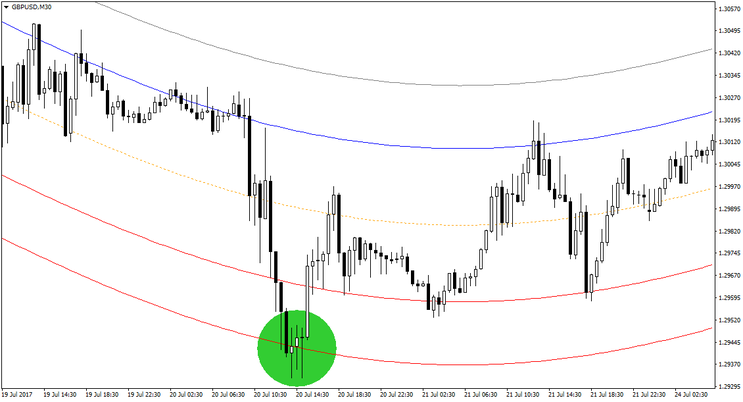
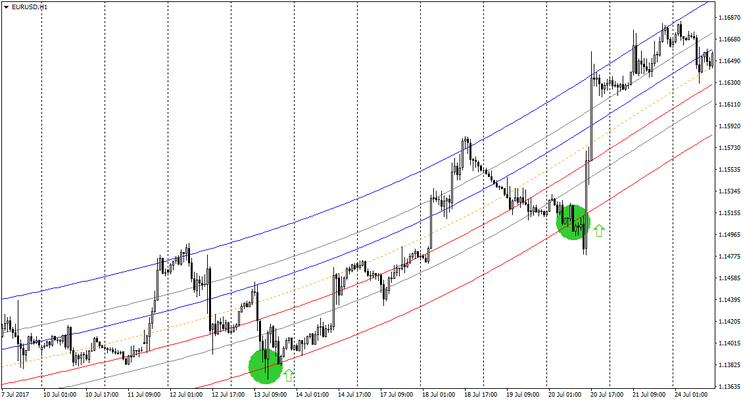
Following the same principle, you can place at a favorable price on trend rollbacks. For example, in the case of an uptrend, we enter or are added when you touch the lower bound of the trend channel.
Trading Rules with Mean Reversion Indicator
Buy
The channel is directed upwards;
The price is close to an important support level;
The price touches the lower levels of the channel.
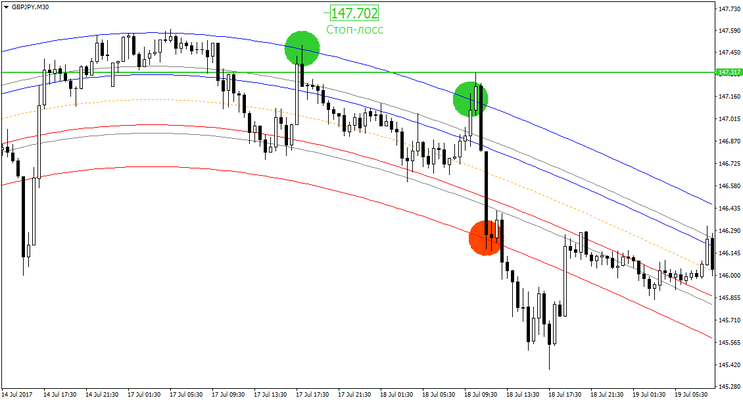
Sell
The channel is directed downwards;
The price is close to an important resistance level;
The price touches the higher levels of the channel.
Stop loss
Above/Below the upper/lower line of the channel.
Example of trades

Legrand (Tuesday, 05 January 2021 10:07)
Good and useful indicator, thank you!