


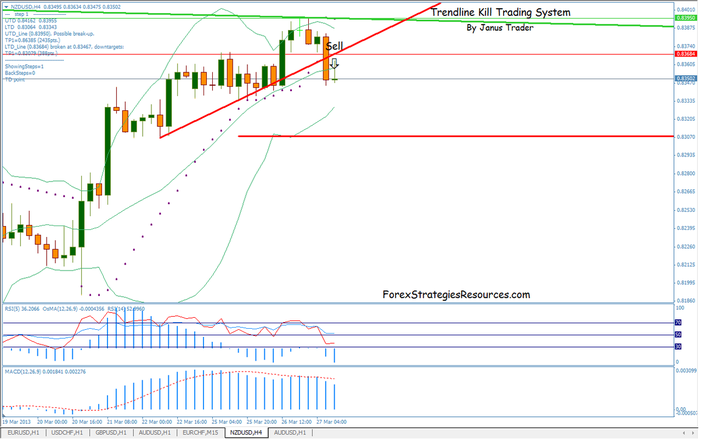
89# Trendline Kill Trading System
Trendline Break
Submit by Janus Trader 27/03/2012
Time Frame 15min or higher
Currency pairs:any.
Forex indicator:
Bollinger bands (20:2);
RSI with OSAMA: RSI(5), RSI (14) OSAMA (12,26,9);
MACD (12,26,9);
Parabolic SAR (0.2, 0.02);
Trendline Indicator Kill (Top left corner indications of the possible breks)
1. Trade in the direction of the trend.
2. trendlines to define the trend, and enter only when the candle breaks the
trendline.
Use another indicator to filter the bad signals.
Long Entry
Possible Trendline Break -up confirmed by candle close above the level;
Parabolic Sar dot below the candle;
RSI (5) >RSI (14) and OSAMa >0;
line of the histogram MACD<bars histogram;
Short Entry
Possible Trendline Break -down confirmed by candle close below the level;
Parabolic Sar dot abowe the candle;
RSI (5) <RSI (14) and OSAMa <0;
line of the histogram MACD>bars histogram.
Exit
Stop loss on the previous swing High or Low.
Profit Target is discretionary or use the indications of Target Profit on the left corner of Trenline Kill indicator.
trendline kill trading system: Template
kill A-T-L metatrader indicator

Trendline Trading Systems
Trendline Trading System - Forex Strategies - Forex Resources ...
Victor Sperandeo Trend line Method Trading System - Forex ...
Instant Trendline Filter Scalping Forex Trading System - Forex ...
Trend line Breakout and Fibonacci Trading System - Forex Strategies
Tom Demark Trend Line Strategy Trading System - Forex Strategies ...
Trendline Candlestick pattern with Fibo Trading System - Forex ...
Trendline Breakout Trading System - Forex Strategies - Forex ...
Trendline Metatrader indicator - Forex Strategies - Forex Resources ...
Trendline Scalping - Forex Strategies - Forex Resources - Forex ...
Mouteky Method Trading System - Forex Strategies - Forex ...

Write a comment