


55# Stochastic, MACD,SMA Trading System
Submit by Joker
Currency pairs:
Any and all – I use the following and make sure I include all the major pairs-
AUD/CAD, AUD/JPY, AUD/USD, CAD/CHF, CAD/JPY, CHF/JPY, EUR/AUD, EUR/CAD, EUR/CHF, EUR/GBP, EUR/JPY, EUR/NZD,
EUR/USD, GBP/AUD, GBP/CAD, GBP/CHF, GBP/JPY, GBP/NZD, GBP/USD, NZD/CAD, NZD/JPY, USD/CAD, USD/CHF, USD/JPY
The reason I use so many is that this is a 4-hour candle strategy, although you can use it for 1 day as well. Each 4 hours (or 1 day) I look at all
the above pairs for a set-up. It only takes a few seconds to look at each one to see if there is a valid set-up. I explain more below.
Chart set-up -
I use MT4 with the following settings:
4hr candlestick (I use white for bull candle and black for bear both with white border, with a black background, but up to you)
SMA10 in blue
Full stochastic with settings 10,6,3
MACD histogram with standard settings of 12,26,9 (I don’t use the two crossing lines, so if you have them, make them, black so they don’t appear against a black background)
Over the page is what the chart should look like in Pic1. You can see I’ve added a couple of lines on the stochastic at 30 and 70 as well as the standard 20 and 80. It’s only a visual thing for me and not important to this strategy although I do use them on another strategy.
Set-Ups and Use
As I said earlier, I check the charts every 4 hours at 8:00, 12:00, 16:00 and 20:00. If I’m wide awake at midnight, I’ll check them then as well.
Longs
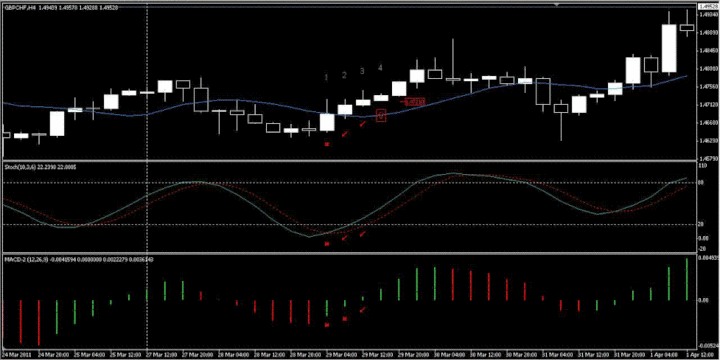
Look at Examples over the page for along set-up. You will see candles labelled 1, 2, 3 and 4 with ticks and crosses, a tick being valid and a cross being not valid.
You’re waiting for the following:
1. Candle to close above SMA10
2. Stochastics crossed to travel upwards and be rising, preferably above 20 but doesn’t have to be
3. MACD histogram to cross from below to above the zero line
At candle 1 - MACD histogram gets a cross because it’s below the zero line. Stochastics haven’t yet crossed. The candle hasn’t finished clearly
above SMA10.
At candle 2 - MACD histogram gets a cross because it’s below the zero line. Stochastics have crossed up so they get a tick. Candle gets a tick
because it’s closed above the SMA10. But we have to wait for all 3 conditions to be good.
At candle 3 – Now all 3 conditions are met and they get 3 ticks.
Wait until candle 3 closes – very important, because it could go back down to finish below the SMA10. So wait until it’s completed.
Entry at open of candle 4 long.
If you zoom in a bit you can see I’ve put the entry price at the side, reading 1.47210.
Stop Losses and Take Profits
Now, where to put Stop Loss (SL) and Take Profit (TP)
This depends on your money management and risk management. An aggressive entry would see the SL just below candle 3, at the low of the candle less 3 pips. A less aggressive entry would put the SL at the low of candle 2 less 3 pips. Or you can choose the low of candle 1 less 3 pips, or even 3 pips below the last swing low at 2 candles before candle 1.

Shorts
Exactly the same principles but in reverse.
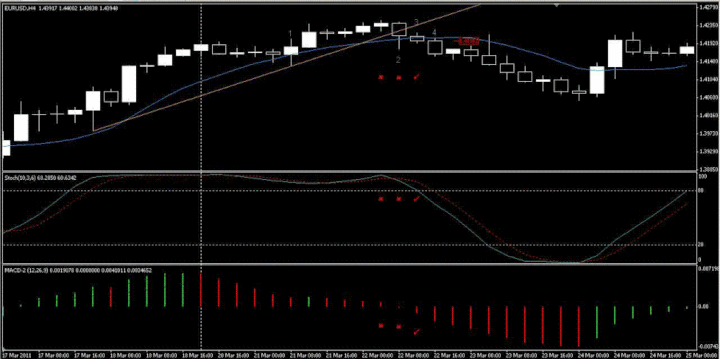
Example shows the short setup as the reverse of the long. This time, I’ve added a confirmation which is a trendline shown in orange. The trend line is
formed by candle 1 and a previous candle that you can see where the trendline comes from.
Candle 2 breaks this line downwards and finishes below it. But candle 2 isn’t a setup yet. Price is still closed above SMA10, the stochastics you
could argue either way, and MACD isn’t below zero yet.
Candle 3 satisfies all the conditions with price closing below SMA10, stochastics crossed and definitely going down, and MACD below zero.
Entry short is at the open of candle 4 at 1.41983.
Stop loss can be placed at the top of candle 2 + 3 pips at 1.4247, giving about 49 pip SL.
Again using 1:2 roughly we want 100 pips profit at 1.40983 (just easier than 98 pips!).
Using 1:3 then we want 150 or a TP at 1.40483.
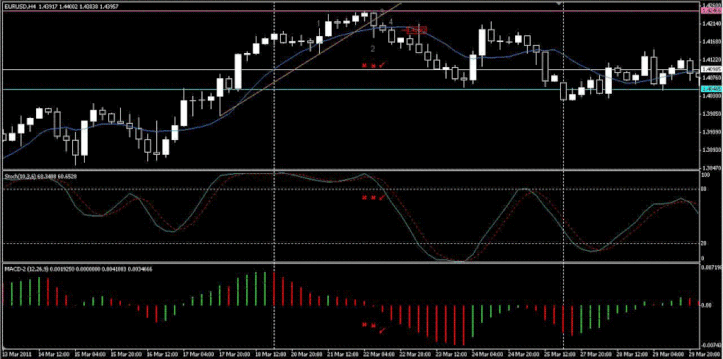
Example shows the entry, SL and two TP points.
Looking at previous price action there seems to be plenty of room to get to the 1:2 level TP and also room for the 1:3. Having said that, the 1:3
level will be getting close to the previous resistance level, so again, I favour 1:2 level, which it hits without a problem.
There are many ways to exit this including moving the SL down to behind the previous bar if you wanted to wait and see if it went to the 1:3 TP
level. Or again, take half profits by selling half the position at the first TP level, moving SL to entry + 10 pips and letting it run.
Now a quick look at one that I wouldn’t take even though it meets the 3 criteria.
Stochastic Forex Strategies
42# Stochastic Trading Method I “ Basic Momentum” - Forex ...
45# Stochastic Trading Method IV, “Spud's MTF FIB Breakout
46# Stochastic Trading Method V, “Spudfyre” - Forex Strategies ...
44# Stochastic Trading Method III “ MTF Scalp ” - Forex Strategies ...
160# Sexy Stochastic method Boxingislife - Forex Strategies -
2# Stochastic Strategy - Forex Strategies - Forex Resources -
159# Sexy Stochastic method Melpheos - Forex Strategies -
17# Stochastic and Ems' cross - Forex Strategies - Forex
19# Double Stochastic - Forex Strategies - Forex Resources -
68# Stochastic Strategy - Forex Strategies - Forex Resources -
55# Stochastic, MACD,SMA - Forex Strategies - Forex Resources ...
18# Stochastic and Awesome - Forex Strategies - Forex
77# Stochastic, MA, and MACD Scalping - Forex Strategies -
65# Stochastic Divergence, Advanced Strategy - Forex Strategies
21# Slow Stochastic, Mas and ADX - Forex Strategies - Forex ...
196# Stochastic Forex Strategy II - Forex Strategies - Forex ...
6# Stochastic and EMA - Forex Strategies - Forex Resources -
14# Sekuntil Stochastic - Forex Strategies - Forex Resources -

darwin (Thursday, 25 August 2022 21:01)
hola.-amigo