


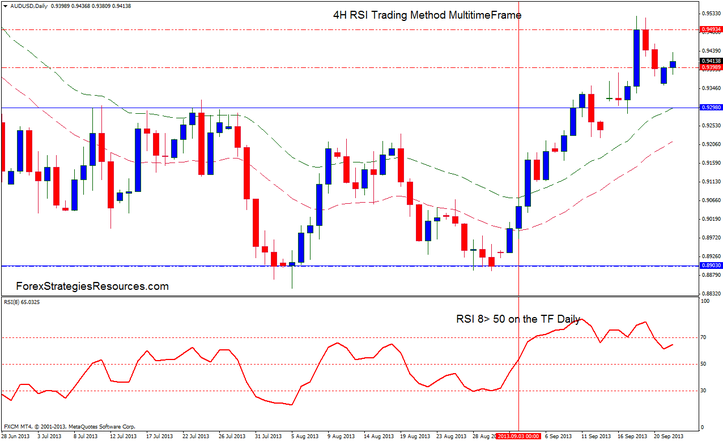
111# 4H RSI Trading Method MultitimeFrame
RSI indicator Trading Method
Submit by Kerry 23/09/2013
This Trading system is based on the RSI indicator on 4H chart and Daily Chart.
Daily chart determine the trade. If RSI indicator (8) periods on daily Chart >50, only buy, if RSI indicator (8) periods, on daily Chart <50 only Sell.
Tradind Rules for 4H RSI Trading Method MultitimeFrame
Time Frame 4H and daiy.
Currency pairs: any,
Forex indicators:
RSI Indicator (8) periods.
EMA Channel formed by two exponentials moving everages 25 periods (high and low).
Long entry:
Buy only when RSI indicator is above level 50 at Daily TimeFrame
Candle closed above 25 EMA and the last two candles must bull candles (blue candles).
RSI 8 at 4hr must be above level 50.
Short Entry
Sell only when RSI indicator is below level 50 at Daily TimeFrame
Candle closed below 25 EMA and the last two candles must bear candles (blue candles).
RSI 8 at 4hr must be belw level 50.
Exit position:
Take profit Ratio 1.4 Stop loss.
Profit Target on the support and resistance lines.
Profit Target predetermined that depends by currency pairs.
Initial stop loss on the previous swing, after 40 pips in gain move stop loss at the entry point.
September 3rd, RSI 8> 50 on the TF Daily, only buy on the 4H TF.

4H RSI Trading multitimeframe
4H RSI Trading Method MultitimeFrame: Template
Support and Resistance 4 Hour
370# Market Momentum MultiTimeFrame - Forex Strategies -
301# Easy 15min Trading System
61# Momentum and Demark Trend line - Forex Strategies - Forex ...
73# Momentum Trend - Forex Strategies - Forex Resources -
260# Trend Strenght - Forex Strategies - Forex Resources - Forex
66# Pip Nailer - Forex Strategies - Forex Resources - Forex Trading
56# Double RSI - Forex Strategies - Forex Resources - Forex ...
40# MACD, RSI, 50 Ema and Pivot Points - Forex Strategies -
31# Winning Pips - Forex Strategies - Forex Resources - Forex ...
60# RSI,ATR, and SMA - Forex Strategies - Forex Resources -
Forex Peak Oscillator Trading System
Stochastic RSI , Accelerator with EMA Channel Trading System
