


14# Adaptive Levels Indicator: The Complete System for Precision Support and Resistance Trading
Emiliano Quantitative Trader 2026
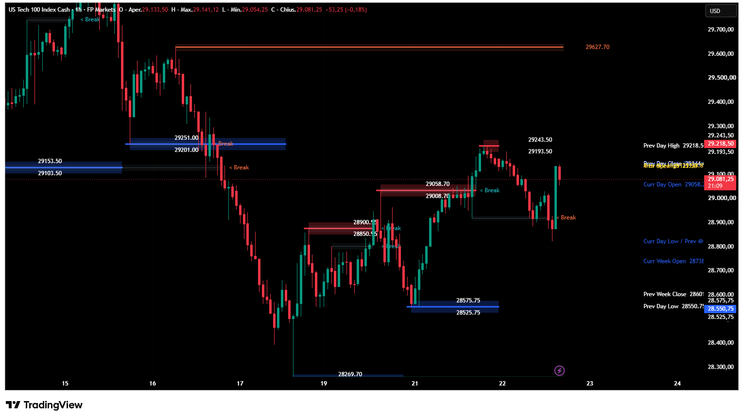
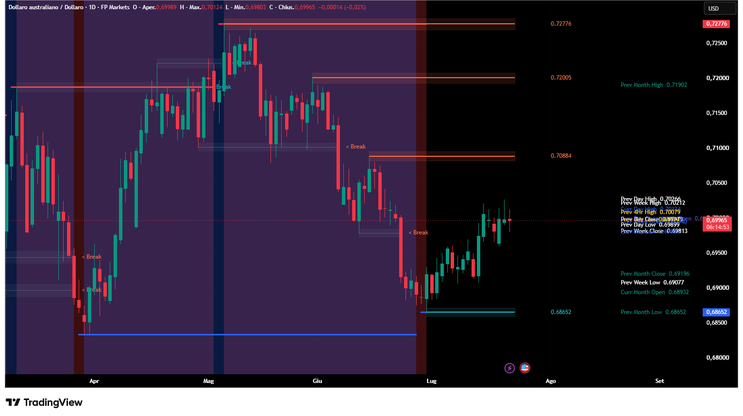
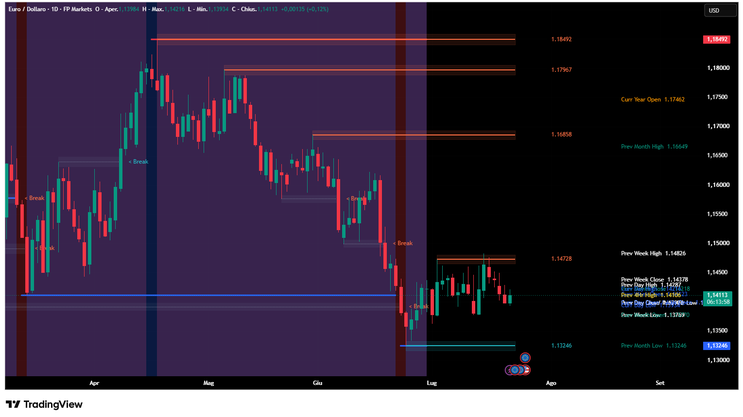
The Adaptive Levels Indicator automates the identification of these levels while filtering market noise and reducing false breakouts. It combines pivot detection, multi‑timeframe analysis, and ATR‑based filtering to provide a complete map of key market levels.
This guide explains how to use the indicator for Support/Resistance strategies and Breakout strategies, forming a complete operational system.
What Makes This Indicator Different
Unlike basic tools that simply draw lines at swing highs and lows, this indicator introduces several advanced features:
Adaptive Pivot Detection: ATR‑based filtering to isolate meaningful pivots. Multi‑Timeframe Confluence: Automatic plotting of levels from Daily, Weekly, Monthly, Yearly, and 4‑Hour timeframes. Smart Merging System: When multiple levels align, they merge into a single label, highlighting high‑probability zones. Dynamic Zone Visualization: Levels are displayed as zones that reflect market volatility. Breakout Confirmation: ATR buffers confirm genuine breakouts and filter weak moves. Role Reversal Tracking: Broken levels remain visible as dotted lines for retest opportunities.
Part 1: Support and Resistance Trading Strategies
Strategy 1: The Confluence Zone Play
Best for swing and position trading on 1H, 4H, and Daily charts.
The strongest support and resistance levels occur when multiple timeframes align. The indicator automatically identifies these confluence zones.
How to trade it:
Identify merged labels showing multiple levels combined. Wait for price to approach the zone. Look for rejection signals such as pin bars, decreasing volume, or oscillator divergence. Enter on the close of the rejection candle. Place the stop loss beyond the zone. Take profit at the next major level or use a risk‑reward ratio of 1:2 or 1:3.
Thicker lines indicate levels tested multiple times and therefore more significant.
Strategy 2: The Zone Bounce
Best for day trading and scalping on 15‑minute, 30‑minute, and 1H charts.
Support and resistance are displayed as zones rather than exact prices. Price often reacts within these zones.
How to trade it:
Enable zone display. Watch for price entering a support or resistance zone. Confirm with price action patterns such as bullish or bearish engulfing, hammer, shooting star, double bottom, or double top. Enter on the confirmation candle close. Place the stop loss beyond the opposite side of the zone. Take profit either at the middle of the range (conservative) or the opposite zone (aggressive).
Optimize settings by using a zone width of 0.25–0.5 ATR and reducing pivot length to 5–8.
Strategy 3: Multi‑Timeframe Alignment
Best for swing trading.
Use higher timeframes for directional bias and lower timeframes for entries.
How to trade it:
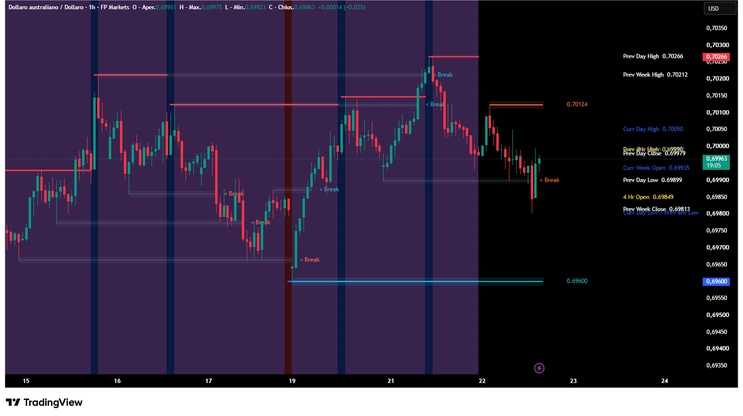
Determine higher timeframe bias. Above previous week and month highs indicates bullish bias. Below previous week and month lows indicates bearish bias. Wait for pullbacks on lower timeframes. Look for confluence between levels such as 4H support aligning with previous day low. Enter on bounce or break of the lower timeframe level. Place the stop loss beyond the confluence zone. Take profit at the next higher timeframe level.
Part 2: Breakout Trading Strategies
Strategy 4: The Confirmed Breakout
Best for momentum trading on 15‑minute, 1H, and 4H charts.
The indicator confirms breakouts using ATR buffers to avoid false moves.
Breakout confirmation requires:
Bullish breakout: Close above resistance plus buffer. Bearish breakout: Close below support minus buffer.
How to trade it:
Watch for breakout labels. Enter aggressively on the breakout candle close or conservatively on a pullback. Place the stop loss below the breakout candle low (bullish) or above the high (bearish). Take profit using the pre‑breakout range or the next major level.
Use break sensitivity of 0.1–0.2 for normal conditions and 0.3–0.5 for choppy markets.
Strategy 5: The Retest Play (Role Reversal)
Best for high‑probability entries across all timeframes.
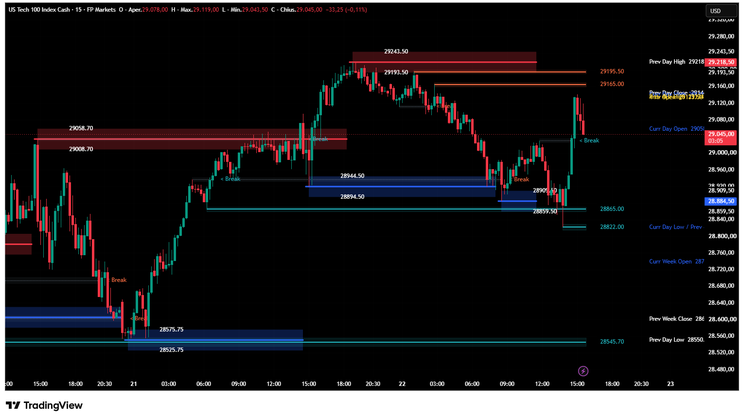
Broken levels often become support or resistance in the opposite direction. The indicator keeps these levels visible as dotted lines.
How to trade it:
Identify broken levels. Confirm a strong breakout. Wait for price to retest the dotted line. Look for rejection signals. Enter on confirmation candle close. Place the stop loss just beyond the dotted line. Take profit at the next active level or using a measured move.
Increase the number of broken levels displayed to see more historical retest opportunities.
Strategy 6: Breakout Failure (Fakeout Trap)
Best for counter‑trend trading on 1H and 4H charts.
Not all breakouts succeed. Some reverse immediately, creating fakeouts.
How to trade it:
Watch for breakout signals. Look for failure signs such as a close back inside the range, strong rejection wicks, or volume divergence. Enter when price closes back inside the broken zone. Place the stop loss beyond the fakeout extreme. Take profit at the opposite side of the range or next major level.
This is an advanced strategy requiring smaller position sizes and clear confirmation.
Part 3: Optimal Settings by Timeframe
Scalping (1–5 minutes): Pivot length 30–50, ATR strength 0.5–1.0, break sensitivity 0.3–0.5. Disable monthly and yearly levels. Enable current day and 4H levels.
Day trading (15–30 minutes): Pivot length 5–8, ATR strength 0.15–0.25, break sensitivity 0.15–0.25, zone width 0.2–0.3. Enable previous day, current day, and 4H levels.
Swing trading (1H–4H): Pivot length 10–15, ATR strength 0.1–0.15, break sensitivity 0.1–0.15, zone width 0.25–0.5. Enable all levels. Show 10–15 broken levels.
Position trading (Daily–Weekly): Pivot length 15–20, ATR strength 0.1, break sensitivity 0.1. Enable week, month, and year levels. Focus on confluence zones and major breakouts.
Part 4: Advanced Tips and Best Practices
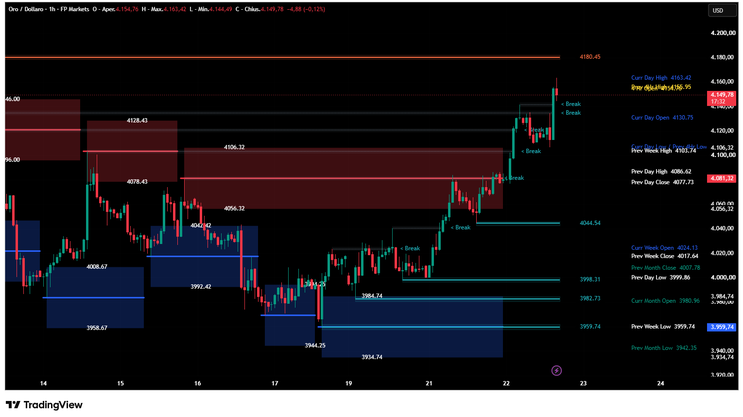
Merged labels indicate high‑probability zones. Line thickness reflects level strength. Combine the indicator with volume analysis. Trade only high‑quality levels. Adjust settings based on market conditions. Use label offset to keep labels visible but unobtrusive.
Part 5: Risk Management Essentials
Risk no more than one to two percent per trade. Always use stop losses. Wait for candle closes. Avoid trading during major news events. Do not chase breakouts; wait for retests. Respect higher timeframe context.
Conclusion
The Adaptive Levels Indicator is a complete trading system offering entry signals, stop loss placement, take profit targets, multi‑timeframe context, and breakout filtering. By applying the strategies in this guide, you can identify high‑probability zones, avoid false breakouts, and adapt to any market condition.
Begin with default settings on 4H or 1H charts, practice identifying confluence zones and breakout confirmations, and start with the retest strategy before expanding to others.

14# DemarK System Trading System
Submit by joy22
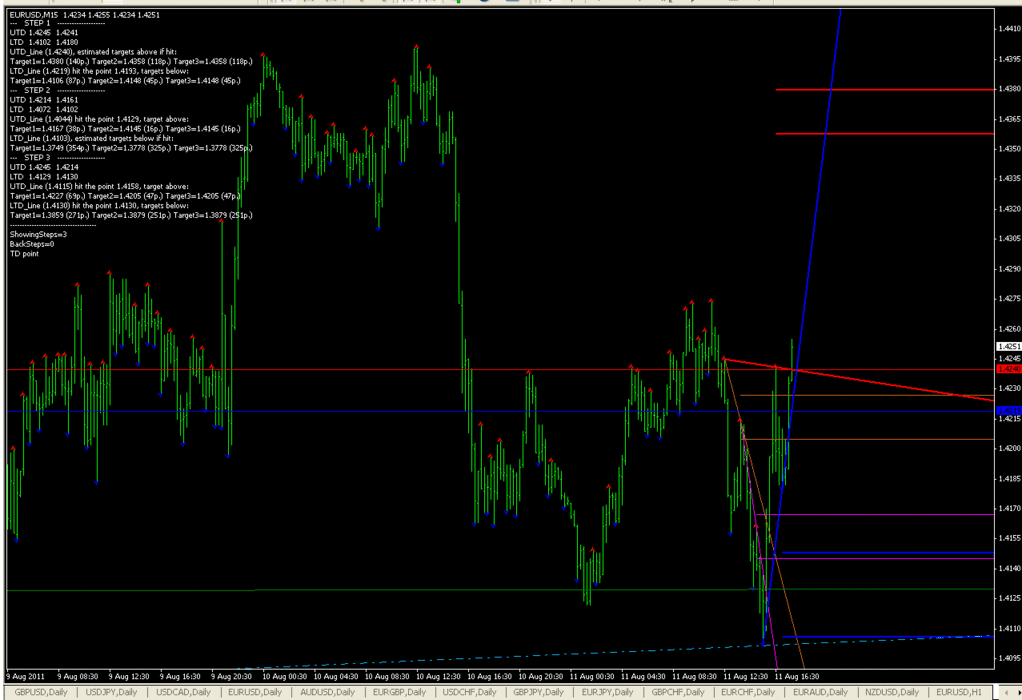
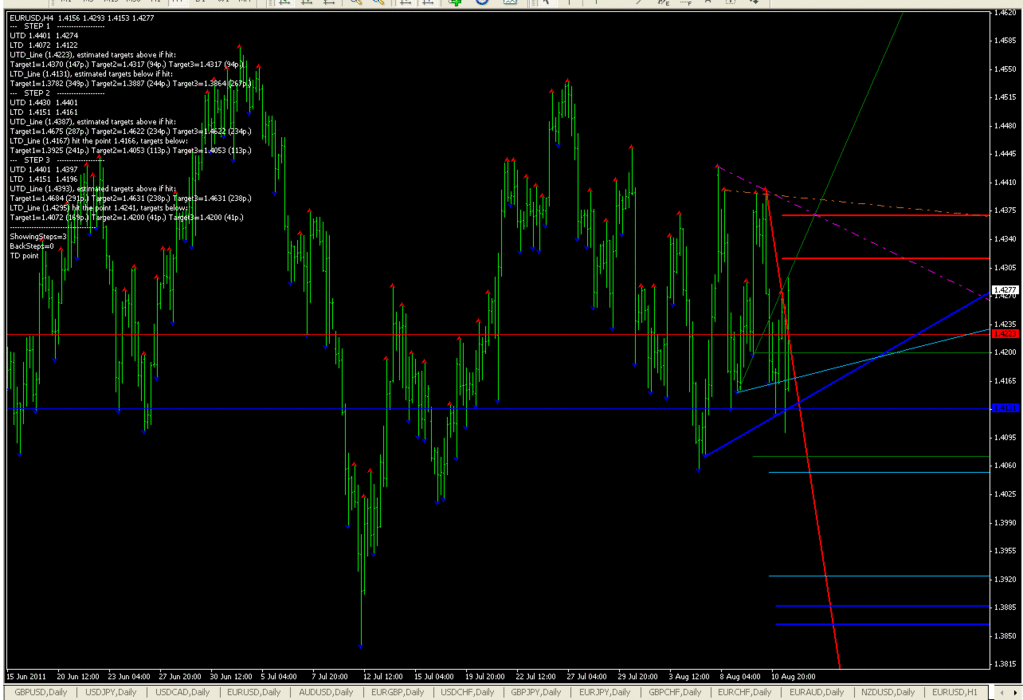
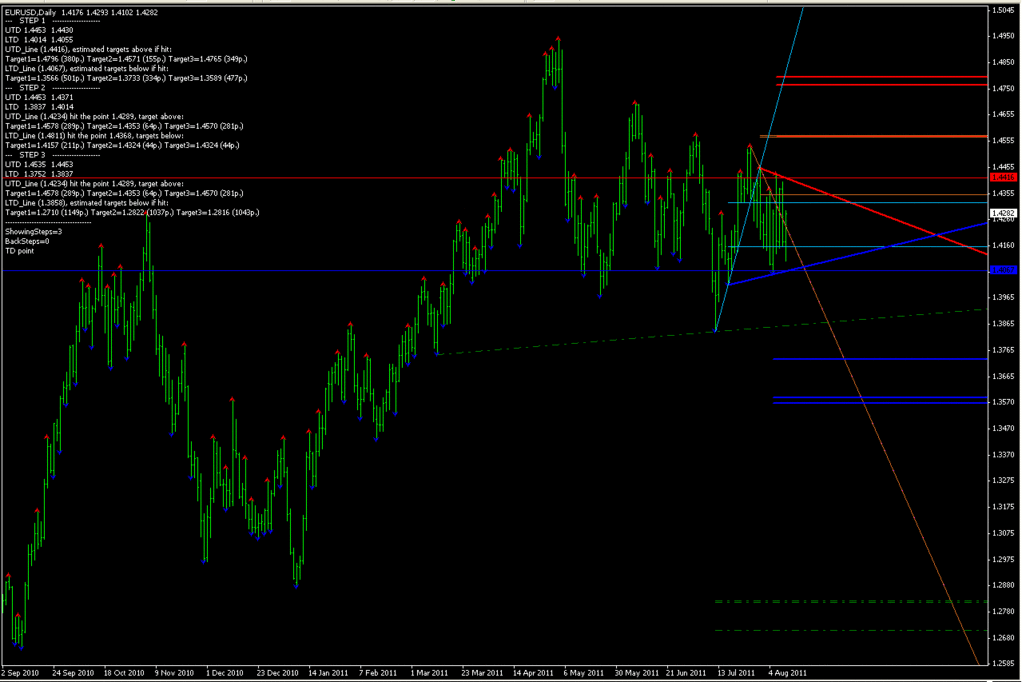
This is Tom Demark points and trend lines. It is predictive indicator and seems to be a trading system.Demark trading system. The settings are the following:
- Commen, if true we will see the comments in the up left side of the chart;
- TD, if true we will see the TD points;
- TrendLine, if true we will see the Trend lines;
- HorizontLine, of true we will see the current value of TD lines by horizontal line in the chart;
- ShowingSteps, value is from 1 to 3. It is predictive steps. Try change this value from 0 to 2 or 3 and see what that is (how many TD lines should be simulteniously on the chart);
- TakeProf, if true we will see the Targets;
- BackSteps, changing all the lines and points on the step back (value=bar);
- FractalAsTD, if true we will see the Williams fractals instead of TD points.
In the pictures DemarK System forex system in action.


Trendline Forex Strategies
22# Trendline Scalper - Forex Strategies - Forex Resources -
78# Advanced Trendline Scalping Strategy - Forex Strategies ...
Trendline Metatrader indicator - Forex Strategies - Forex Resources ...
6# Trend line Breakout and Fibonacci - Forex Strategies - Forex ...
116# Trendline Forex Entry Signal, Two High Probability Setups ...
104# Tom De Mark Trend line Strategy - Forex Strategies - Forex
38# Trendline Breakout - Forex Strategies - Forex Resources -
61# Momentum and Demark Trend line - Forex Strategies - Forex ...
119# Sperandeo Victor, Trendline Method - Forex Strategies -
312# Instant Trendline forex Strategy - Forex Strategies - Forex ...
8# Trendline Candelstick pattern with Fibo - Forex Strategies -
117# Trendline System - Forex Strategies - Forex Resources -
189# Instant Trendline Filter Scalping - Forex Strategies - Forex ...
Forex Books about trend line e pattern. - Forex Strategies - Forex ...
16# Mouteki System - Forex Strategies - Forex Resources - Forex ...
DeMark Metatrader Indicator - Forex Strategies - Forex Resources ...
2# Tom Demark FX system - Forex Strategies - Forex Resources ...
14# DeMarK System - Forex Strategies - Forex Resources - Forex
