


27# Estimations Indicator -TradingView-
Janus Trader 2026
The Estimations Indicator is a trading tool designed to help traders identify market direction and potential entry points using trend analysis and price behavior. It simplifies the interpretation of market structure by providing clear visual signals for both long and short opportunities.
The indicator combines trend-following logic with elements inspired by institutional trading concepts. Instead of requiring complex manual analysis, it automatically highlights moments when market momentum shifts. These shifts are displayed directly on the chart through visual signals that indicate potential buying or selling opportunities.
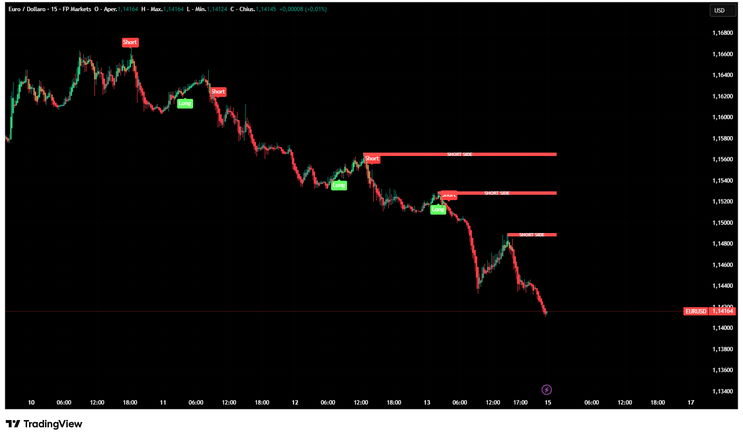
In the example shown on the chart, the indicator is applied to the EUR/USD market on a 15-minute timeframe. The sequence of signals clearly follows the overall bearish market structure, where the market continues forming lower highs and lower lows. In this environment the indicator generates several short signals, helping traders align with the prevailing trend.
The main goal of the indicator is not only to signal entries but also to help traders understand the direction of the market and focus on high-probability setups.
Setup
The indicator is designed to be simple to configure and adaptable to different trading styles. It works by smoothing price movements to identify the underlying trend while filtering out short-term market noise.
The most important parameter is the moving average length, which determines how sensitive the indicator is to price changes. A shorter length produces more signals and reacts faster to price movement, while a longer length filters noise and produces more stable signals.
Another key feature is the option to smooth the data using an alternate timeframe calculation. This allows the indicator to simulate higher timeframe behavior even when trading on lower timeframes. By doing so, the signals become more reliable and better aligned with the broader market direction.
The indicator can also visually color the chart to represent the current trend direction. When the market is bullish, the chart reflects positive momentum, while bearish conditions highlight downward pressure. This visual aid helps traders quickly identify whether they should focus on buying opportunities or selling opportunities.
Because of its flexibility, the indicator can be used across multiple markets including forex, cryptocurrencies, and indices. It works particularly well on intraday timeframes such as 5 minutes, 15 minutes, and 1 hour.
Buy Rules
A buy signal appears when the indicator detects that bullish momentum is beginning to dominate the market. This happens when the smoothed price movement indicates that buyers are gaining control and the market may begin moving upward.
When this condition occurs, the indicator prints a green “Long” label directly on the chart. This signal suggests that a potential upward move could be starting.
However, traders should not rely solely on the signal itself. The best long setups occur when the signal appears during a pullback within an existing uptrend. In this situation the market temporarily retraces before continuing higher.
An ideal long trade usually appears when the market forms higher lows and the indicator confirms the continuation of the bullish structure. Traders can enter the trade at the close of the signal candle or on a small retracement immediately after the signal appears.
For risk management, the stop loss is typically placed below the most recent swing low or below a support area where the market previously reacted. Profit targets can be placed near previous highs or other areas where the market may encounter resistance.

Sell Rules
A sell signal appears when the indicator detects a shift toward bearish momentum. This means that sellers are beginning to dominate the market and price may start moving downward.
When this happens, the indicator prints a red “Short” label above the candle. This signal suggests that a potential downward move may begin.
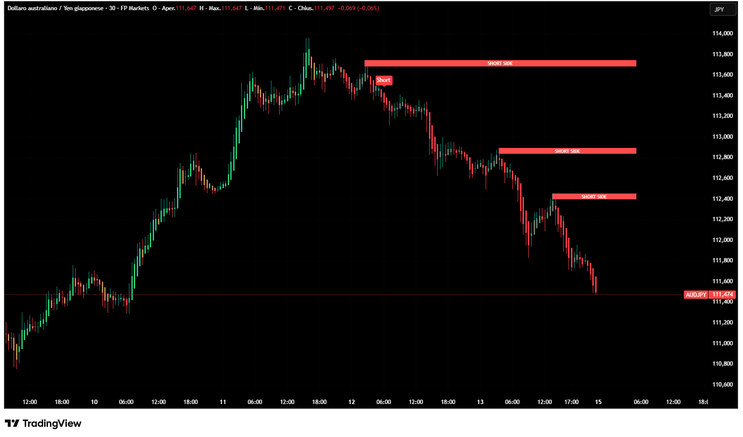
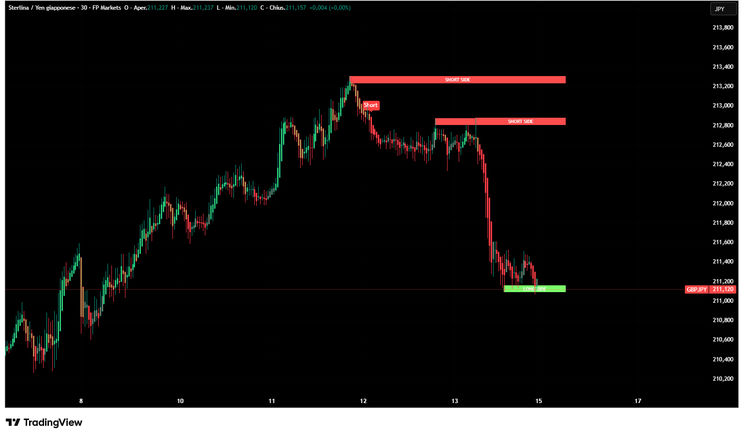
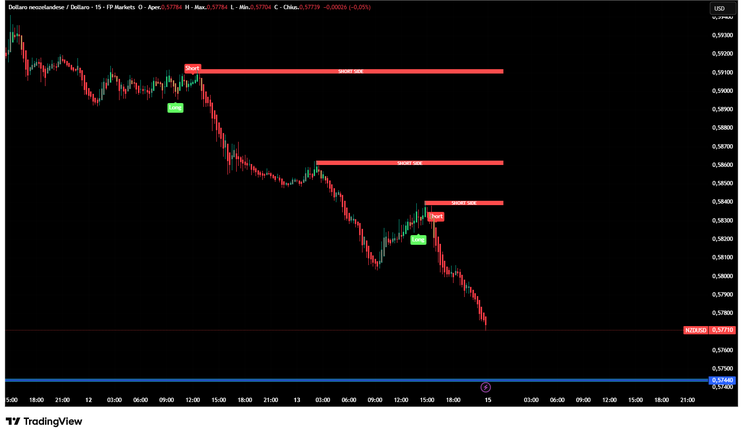
The strongest short setups occur when the signal aligns with a clear downtrend. In such conditions the market forms a sequence of lower highs and lower lows. The indicator often produces repeated short signals as the trend continues, allowing traders to enter the market during pullbacks.
Each signal forms near a temporary retracement before the trend continues lower. This behavior highlights how the indicator can help traders join an established trend rather than attempting to predict reversals.
For short trades, the stop loss is typically placed above the most recent swing high or above a resistance level. Profit targets can be set at previous lows or at areas where price previously consolidated.

Conclusion
The Estimations Indicator provides a simple but effective way to identify trend direction and potential trading opportunities. By smoothing price movements and highlighting changes in momentum, it helps traders focus on the most relevant market signals.
One of the main strengths of the indicator is its ability to align entry signals with the broader market trend. Instead of producing random signals, it tends to follow the structure of the market, which allows traders to participate in sustained movements rather than short-lived fluctuations.
When combined with proper risk management and an understanding of market structure, the indicator can become a valuable part of a trader’s strategy. Traders should focus on taking signals that align with the prevailing trend and avoid trading during periods of low volatility or sideways market conditions.
Used correctly, the Estimations Indicator can help simplify decision-making and provide a clearer view of where momentum is shifting in the market.
27# Algoman Backtest V1 (PAC) Forex Strategy
Price Action Concepts, Complete Trading System with TradingView
Submit by Karl written by Algomanlifie
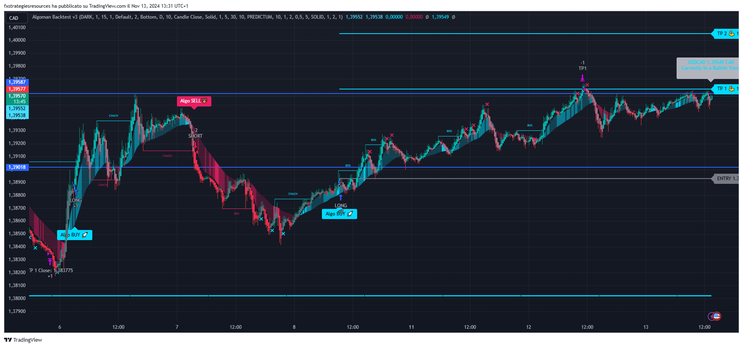
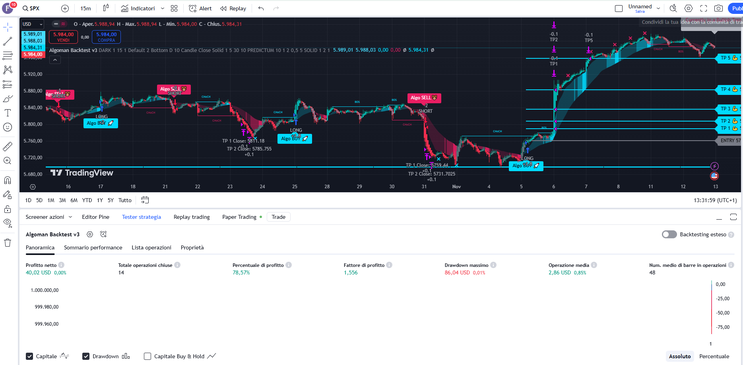
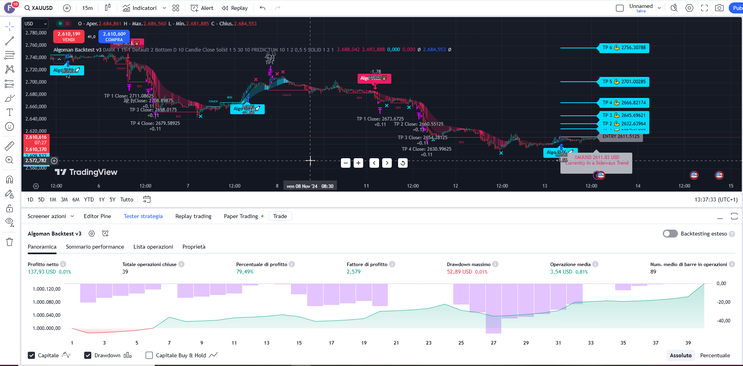
The Algoman Backtest V1 (PAC), is a groundbreaking tool designed to empower traders by allowing them to develop and backtest a wide variety of price-action-focused strategies. With an emphasis on flexibility and data-driven decisions, this script enables traders to construct and optimize discretionary trading strategies that are responsive to real-time market conditions.
Leveraging the innovative Step & Match algorithm, traders can define highly customizable entry and exit conditions based on price action dynamics like market structure, order blocks, and imbalances, while also integrating external indicators. The result is a dynamic, personalized trading experience that is both powerful and adaptable.
Key Features of the Algoman Backtest V1 (PAC)
1. Step & Match Algorithm
The Step & Match algorithm is the core innovation driving Algoman Backtest V1 (PAC), providing an advanced framework for setting up complex entry rules by using multiple conditions:
-
Matching Conditions: When multiple conditions share the same step number, they are evaluated simultaneously, allowing traders to test multiple scenarios and improve accuracy by setting highly specific triggers.
-
Sequential Conditions: When conditions have different step numbers, each is assessed in sequence, only moving to the next step after the preceding condition is satisfied. When the final step is true, a market order is triggered, making it ideal for strategies that rely on a series of unfolding events.
This dual functionality enables traders to build intricate strategies that combine multiple conditions in unique ways, enhancing their ability to capture precise market entries and exits.
2. Fully Customizable Price Action Concepts
The PAC version takes price action to new heights by allowing users to define entries based on key market behaviors and structures, including:
-
Market Structure: Commonly used to assess trend direction, market structure focuses on price breaking prior swing points. Traders can use these structures as entry triggers, capitalizing on trend continuations or reversals.
-
Order Blocks: These areas indicate institutional interest and are zones where large liquidity might reside. Traders can leverage order blocks as entry points, expecting that price interactions with these zones may signal significant buying or selling activity.
-
Market Imbalances: Representing supply-demand disparities, imbalances are highly effective for entries. Price interactions with imbalances can provide insights into potential reversals or continuations as the market seeks equilibrium.
-
External Sources Integration: To further enhance strategy flexibility, traders can add external indicators like moving averages, bands, or trailing stops, creating conditions that align with a trader’s unique approach or preferred indicators.
3. Comprehensive Alert System
The Algoman Backtest V1 (PAC) includes a fully functional alert system designed to notify users about every significant action taken by the strategy—from opening to closing positions. The system allows for custom alert messages, providing clear, personalized notifications. If a custom message is not set, default notifications will be sent to keep the trader informed.
Release Notes – Latest Enhancements
The Algoman team continually enhances the backtesting system, and recent updates include several performance and functionality improvements:
-
Forecast Method for Take Profits: New forecast-based take profit levels, allowing users to set take profit levels based on forecasted price percentiles.
-
Trade-Based Price Forecasting: Adds a new price forecasting feature that improves trade outcome predictions.
-
Stop Loss Management: The stop loss calculation has been updated to include options for manual percentage-based stops or automated stops based on Fibonacci retracements (0.786/0.236 levels).
-
RSI Customization: RSI settings now highlight overbought and oversold zones with visual cues, aiding traders in recognizing potential reversal points.
-
Improved Alerts and Conditions Handling: Numerous fixes ensure that alerts, take profits, and stop loss values operate accurately and reliably across different strategy setups.
How to Use Algoman Backtest V1 (PAC) for Price Action Strategies
To effectively use Algoman Backtest V1 (PAC), a trader can follow these steps to design a robust price-action-based strategy:
-
Define Entry and Exit Conditions Using Price Action Concepts: Leverage market structure, order blocks, and imbalances to create unique entries tailored to current price action.
-
Set Sequential and Matching Conditions: Use the Step & Match algorithm to set complex triggers. For example, you might create a sequence where price breaks a prior swing high (Step 1), enters an order block (Step 2), and closes with a bullish candle (Step 3) to confirm a buy entry.
-
Enable Alerts and Notifications: Customize alerts for significant actions, ensuring you’re instantly notified of trades and any essential updates.
-
Adjust Risk Management Settings: Utilize the forecast-based take profit and stop loss features to safeguard your trades, and set dynamic stops based on Fibonacci levels or percentage targets.
-
Backtest and Optimize: Run backtests to refine conditions and optimize results for different market scenarios.
Conclusion
The Algoman Backtest V1 (PAC) empowers traders with a versatile framework to create data-driven, price-action-focused strategies. Its customizable approach, paired with the innovative Step & Match algorithm and robust alert system, provides all the tools needed to capture high-quality trades, manage risk, and stay informed.
By building a strategy that adapts to market structure and order flow while integrating real-time alerts and forecast-based risk management, Algoman Backtest V1 (PAC) is the ideal choice for traders seeking a sophisticated yet intuitive backtesting solution.
Add script at your chart : https://it.tradingview.com/v/vCqyCiZv/
Options Strategy Trading System
Submit by Janus Trader (written Sam Seiden) 16/01/2012
There are literally hundreds of options strategies, many more if you include the vast
array of complex strategy combinations. Why so many? Simple, it’s because most
options speculators can’t figure out price direction. Instead, they rely on complex
option strategies and a variety of standard pricing models that don’t work and simply
add illusion to a constant simple reality of all markets: supply (resistance) and demand
(support).
When you filter out illusion and replace it with pure supply and demand analysis in options trading, you not only simplify the useless complexity of options, you discover endless low risk-high reward opportunity based on a set of objective rules. This opportunity is one in which the reality-based options speculator simply derives his or her profit from the illusion- or emotion-based options speculator.
See Manual
In the pictures Options Strategy forex system in action.
21# 15 min GBP/USD Range Breakout - Forex Strategies - Forex
28# 4H Strategy: RSX and Murrey Math - Forex Strategies - Forex
7# Hedging Strategy Sure-Fire - Forex Strategies - Forex
17# CCFp Diff v2, Basket Trading - Forex Strategies - Forex ...
15# Ademola Forex - Forex Strategies - Forex Resources - Forex ...
2# Minor Reaction/Trend Resumption - Forex Strategies - Forex ...
