


26# Session Volume Profile with Previous Day Overlay
Maximo Trader 2026
The Session Volume Profile with Previous Day Overlay is a professional TradingView indicator designed to provide a detailed view of market structure and order flow within a single chart. It combines two fully independent volume profile engines: one that builds the current session profile in real time and another that projects the previous session profile over the current trading day. This dual approach allows traders to compare current price action with the prior day's most significant volume concentrations and value areas.
Unlike simplified volume profile tools that approximate volume using a single candle, this indicator reconstructs the true distribution of traded volume using lower-timeframe intraday data
through request.security_lower_tf(). The result is a highly accurate profile that shows where buyers and sellers were most active throughout the session.
The session range is divided into a configurable number of equally sized price bins. For every lower-timeframe candle, volume is allocated proportionally across all bins intersected by that candle. Each portion of volume is then decomposed into bullish and bearish components using a body and wick weighting model. This technique produces a two-sided histogram that highlights the relative dominance of buyers and sellers at every price level.

From this volume distribution, the indicator calculates the three most important Market Profile reference levels. The Point of Control (POC) represents the price level with the highest traded volume and often acts as a magnet for price. The Value Area High (VAH) and Value Area Low (VAL) define the boundaries containing approximately 70 percent of the session's volume and represent the market's accepted range of fair value.
The current session profile updates dynamically as new bars arrive. Traders can observe whether value is shifting upward, downward, or remaining balanced. When the developing POC migrates higher, it indicates strengthening demand. When it migrates lower, it suggests increasing selling pressure. A stable POC usually reflects a balanced market.
The previous session profile is displayed only across the current day's bars, creating a clean and intuitive overlay. This feature makes it possible to compare current price behavior with the prior session's POC, VAH, and VAL without cluttering historical data. Traders can immediately assess whether the market is accepting previous value, rejecting it, or transitioning into a new value area.

Additional optional features include Daily Open and Weekly Open levels, which serve as powerful reference points for directional bias. Price trading above the Daily Open generally indicates bullish intraday conditions, while price below the Daily Open suggests bearish conditions. The Weekly Open provides broader market context and is often respected as a major institutional reference level.
The indicator can also display Forex session boxes for the Asian, London, and New York sessions. These boxes define the high-low range of each trading session and help identify accumulation zones, session breakouts, and liquidity shifts.
The practical applications of this indicator are extensive. In mean-reversion environments, price excursions beyond VAH or VAL that fail to attract further participation often rotate back toward the POC. In trending markets, sustained trading above VAH or below VAL accompanied by expanding volume can signal value migration and continuation. Previous session POC levels frequently act as support, resistance, or magnets, while Daily and Weekly Opens provide valuable context for directional bias.
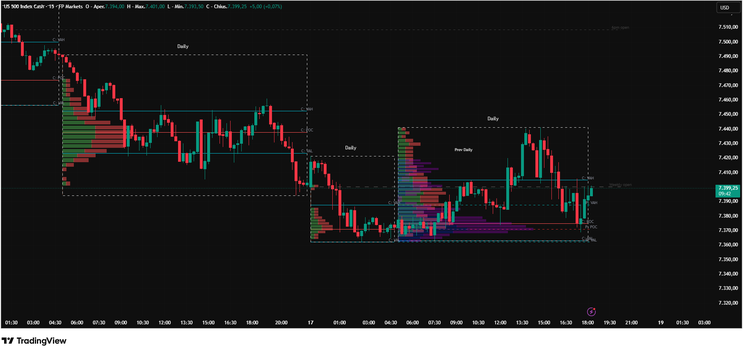
The screenshot of the US500 chart illustrates how multiple profiles can be used to interpret price behavior. The current session profile reveals where today's volume is concentrating, while the previous day's profile highlights key historical value levels. The interaction between current price and these reference points offers a clear picture of market acceptance and rejection.
This indicator is particularly effective on liquid markets such as the S&P 500, NASDAQ, DAX, major forex pairs, gold, crude oil, and cryptocurrencies. It performs well across intraday timeframes including 1-minute, 5-minute, 15-minute, and 30-minute charts.
The Session Volume Profile with Previous Day Overlay is more than a visual enhancement. It is a complete auction market analysis framework that combines real-time order flow, historical context, and institutional reference levels into a single tool. For traders who want to understand where the market considers price fair and how value evolves throughout the trading session, this indicator provides one of the most powerful and informative perspectives available on TradingView.
26# Double Channels Trading System
Channel Strategy
Submit by Joy22 (Written by Darmawan) 04/01/2012
1. Pairs => any
2. TF => 1H and above (never test on lower TF)
Indicators:
Nonlagdot(20)
IBFX-Waves.ex4
Supertrend
how to set the channels :
1st channel : draw/drag the equidistance channel line from A to C then put the other channel line on B
2nd channel : draw/drag the equidistance channel line from B to D then put the other channel line on C
then draw the horizontal line on A, B, C, D and all (i really mean All) channel line crossover to set the R/S line.
set your supertrend and nonlagdot to 20.
Rules :
=> Buy : supertrend and nonlagdot have the positive color could be blue or green depend on your color set
TP : next SR line ( i prefer to use nearest grid line to SR line)
Exit: supertrend or nonlagdot change to negative color red or depend on your color set or new price open below the support line.
=> SELL : opposite from buy condition.
Alternative Change trend indicators with
gann hilo activator, gann hilo activators bar, gann hilo activator arrow
Double Channels


Channel Forex Strategies
25# Channel Strategy - Forex Strategies - Forex Resources -
123# ATR Channels Strategy - Forex Strategies - Forex
13# Donchian Channels - Forex Strategies - Forex Resources ...
13# Fibopivot Channel Strategy - Forex Strategies - Forex ...
11# Keltner Channels and EMA - Forex Strategies - Forex ...
31# ADX and Moving -Average Channel - Forex Strategies - Forex
16# Moving Average Channel and Parabolic Sar - Forex
77# Two MA Channel - Forex Strategies - Forex Resources -
111# Mj Regression Channel and FX Sniper Ergodic CCI - Forex ...
66# Envelope Reversal - Forex Strategies - Forex Resources -
5# Channel Breakout and Moving Average - Forex Strategies ...
153# Dynamic Channel, Contrarian Strategy. - Forex Strategies ...
2# Volatility breakout channel - Forex Strategies - Forex
17# Bollinger Bands and Equidistant Channel - Forex Strategies ...
10# SRDC Method Level II - Forex Strategies - Forex Resources ...
12# SRDC Method Level III - Forex Strategies - Forex Resources ...
9# SRDC Method Level I - Forex Strategies - Forex Resources ...
Volatility Forex Strategies - Forex Strategies - Forex Resources ...
2# Volatility breakout channel - Forex Strategies - Forex
123# ATR Channels Strategy - Forex Strategies - Forex Resources
7# ATR Breakout - Forex Strategies - Forex Resources - Forex ...
6# ATR Channel Breakout - Forex Strategies - Forex Resources ...
