


16# The Daily 5 Trading Strategy
Joy22 2026
The Daily 5 is a low-maintenance trend-following trading strategy designed for traders who do not want to spend the entire day watching charts.
The strategy uses the Daily timeframe (D1) and requires only a few minutes of attention each
day.
Its core philosophy is simple:
-
Let profitable positions run
Close losing positions daily
Stay positioned for both market directions
Focus on equity growth rather than short-term balance fluctuations
This strategy works especially well in trending markets.
Core Principles
-
Timeframe: Daily (D1)
Trading style: Trend-following / Buy & Hold hybrid
Analysis required: Minimal
Indicators: Optional
Main focus: Equity growth
Best market condition: Trending pairs
Broker requirement: Must allow hedging
Step-by-Step Rules
Step 1 — Choose a Market
Select a currency pair or asset with strong trending behavior.
Avoid:
-
Highly ranging markets
Choppy sideways conditions
Good examples:
-
GBP/JPY
XAU/USD
USD/CAD during strong macro trends
Step 2 — Initial Setup
At the beginning:
Open:
-
1 BUY position
1 SELL position
Both positions must:
-
Have the same lot size
Have no Stop Loss
Have no Take Profit
Example:
|
Position |
Lot Size |
|---|---|
|
BUY |
0.10 |
|
SELL |
0.10 |
At this stage, you are neutral and ready for whichever direction the market chooses.
Step 3 — Daily Management
Check the chart once per day, preferably:
-
10–15 minutes before the daily candle closes
Rule A — Strong Bullish Candle
If the daily candle closes bullish and its body is larger than 10–15 pips:
-
Keep the profitable BUY open
-
Close the losing SELL
-
Open a new SELL position
This creates a layered trend exposure.
Rule B — Strong Bearish Candle
If the daily candle closes bearish and larger than 10–15 pips:
-
Keep the profitable SELL open
-
Close the losing BUY
-
Open a new BUY position
Rule C — Small Candle / Doji
If the candle body is smaller than 10–15 pips:
Do nothing.
The market is indecisive and opening/closing positions would only generate extra costs.
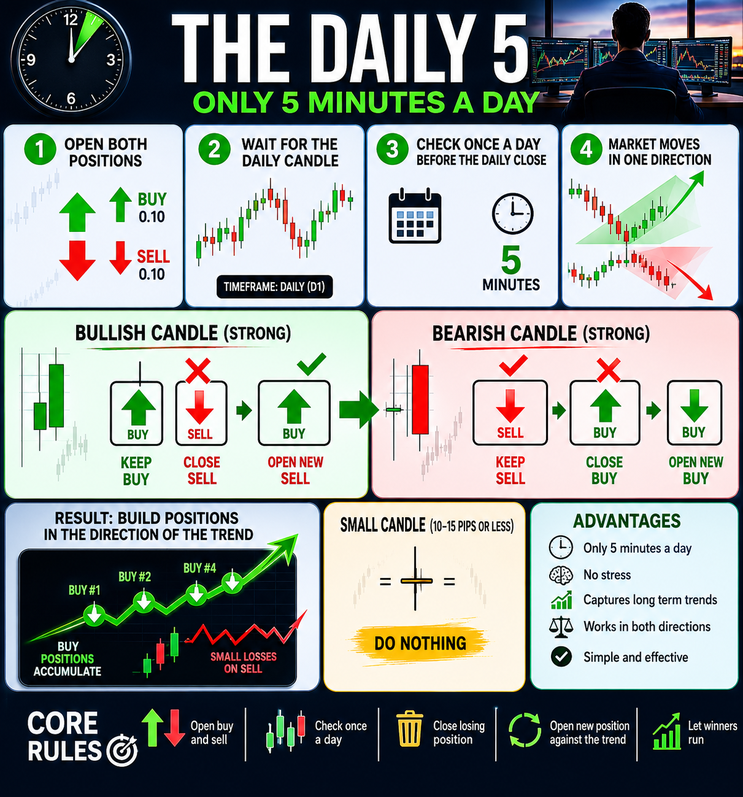
How the Strategy Makes Money
The strategy continuously:
-
Removes weak positions
Keeps strong trend positions alive
Builds multiple entries during trends
During strong trends, older positions accumulate large floating profits.
The key idea is:
Small daily losses are acceptable if long-term trend positions continue growing.
Trend Accumulation Example
Imagine a bullish market:
Day after day:
-
BUY positions remain profitable
SELL positions are closed and reopened
Over time:
|
Position |
Result |
|---|---|
|
BUY #1 |
+500 pips |
|
BUY #2 |
+300 pips |
|
BUY #3 |
+180 pips |
|
SELL |
Small controlled losses |
The accumulated long positions can largely outweigh the repeated small hedge losses.
Handling Trend Reversals
When the market shows signs of reversal:
-
Strong engulfing candles
Broken support/resistance
Trendline breaks
Weekly resistance zones
You may:
-
Close all profitable trend positions
Partially reduce exposure
Restart the strategy from zero
This is the most discretionary part of the system.
Advanced Optimization
Instead of reopening immediately at market price:
Use:
-
SELL LIMIT orders above bullish candles
BUY LIMIT orders below bearish candles
This creates a small “gap advantage” that can:
-
Cover spreads
Reduce costs
Slightly improve profitability

Risk Management
This strategy can create:
-
Large floating drawdowns
Long holding periods
Margin pressure during ranging markets
Therefore:
-
Use small lot sizes
Avoid overleveraging
Focus on equity, not temporary balance
Never risk money you cannot afford to lose
Advantages
Pros
-
Very little screen time
Minimal stress
Captures long-term trends
No need for constant analysis
Works without indicators
Cons
-
Difficult during ranging markets
Requires emotional discipline
Floating drawdowns may become large
Hedging costs/swaps can accumulate
Final Concept
The Daily 5 strategy is not about predicting the market.
It is about:
-
Staying involved in every movement
Letting trends build naturally
Using time and probability instead of prediction
The philosophy is:
“You do not need to know where price will go.
You only need to be positioned when it moves.”

Example 1 — Trend Accumulation (Bullish Scenario)
DAY 1
Open 1 BUY position and 1 SELL position with the same lot size without Stop Loss and Take Profit
Example
BUY 0.10
SELL 0.10
At this point the strategy is neutral and ready for whichever direction the market chooses
DAY 2
The market closes with a strong bullish candle
Actions
Keep the BUY position open because it is now profitable
Close the SELL position because it is losing
Open a new SELL position
Current situation
BUY1 = running profit
SELL2 = new hedge position
DAY 3
Another bullish candle appears
Actions
BUY1 continues growing
SELL2 becomes negative
Close SELL2
Open SELL3
Current situation
BUY1 = larger profit
SELL3 = active hedge
DAY 4
Bullish momentum continues
Actions
Keep BUY1 open
Close SELL3
Open SELL4
The trend starts building equity progressively
DAY 5
Another bullish candle forms
Actions
BUY1 accumulates more profit
Close SELL4
Open SELL5
At this stage one long-term BUY position is carrying the trend while small SELL losses remain controlled
DAY 6 — Pullback Appears
A strong bearish candle appears
Current situation
BUY1 is still in profit
SELL5 also becomes profitable because price retraced
Actions
Do not close anything yet
Open a new BUY position called BUY2
Reason
The market may simply be correcting before continuing upward
DAY 7 — Trend Resumes Upward
The bullish trend resumes strongly
Current situation
BUY1 = large profit
BUY2 = profit
SELL5 = loss again
Actions
Close SELL5
Open SELL6
Now the strategy has multiple profitable BUY positions while SELL losses remain small and controlled
Result of Example 1
During strong trends the profitable BUY positions accumulate while the losing SELL positions remain relatively small
The strategy continuously builds positions in the direction of the dominant trend without needing to predict the market direction
Winning positions grow over time while losing hedge positions are managed daily
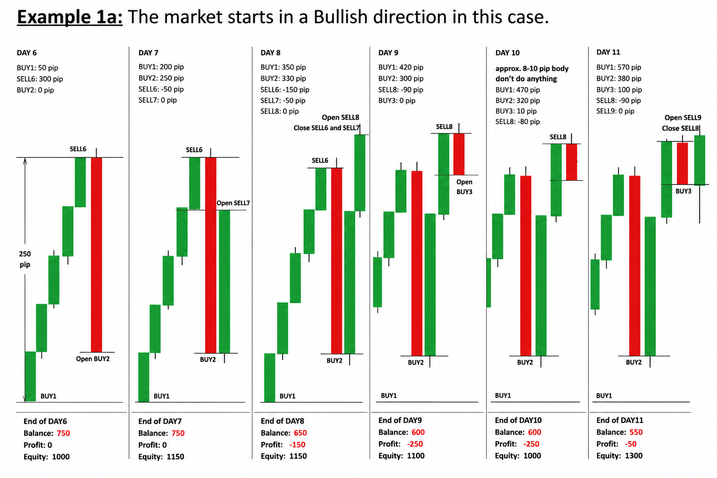
Example 1A — Bullish Continuation Scenario
DAY 7A
The market continues upward with another bullish candle
Current positions
BUY1 = profit
BUY2 = profit
SELL6 = small loss
Actions
Keep BUY1 and BUY2 open
Close SELL6
Open SELL7
The bullish trend remains strong and the long positions continue accumulating value
DAY 8A
Another bullish candle closes
Current situation
BUY1 grows further
BUY2 grows further
SELL7 becomes negative
Actions
Close SELL7
Open SELL8
The strategy keeps replacing losing SELL positions while profitable BUY positions continue running
DAY 9A
A bearish candle appears after several bullish days
Current positions
BUY1 = strong profit
BUY2 = profit
SELL8 = now also profitable because of the pullback
Actions
Do not close any position
Open BUY3
Reason
The market may only be retracing before continuing upward
DAY 10A
The market forms a small doji candle with little movement
Actions
Do nothing
Keep all positions open
The market is indecisive and unnecessary operations would only increase costs
DAY 11A
The bullish trend resumes strongly
Current positions
BUY1 = large profit
BUY2 = profit
BUY3 = profit
SELL8 = loss again
Actions
Close SELL8
Open SELL9
The strategy now has multiple profitable BUY positions layered into the trend
Result of Example 1A
In a strong bullish continuation the BUY positions accumulate exponentially while the SELL losses remain small and controlled
Pullbacks create additional opportunities to build new profitable entries
The strategy benefits from staying inside the trend instead of trying to predict tops and bottoms
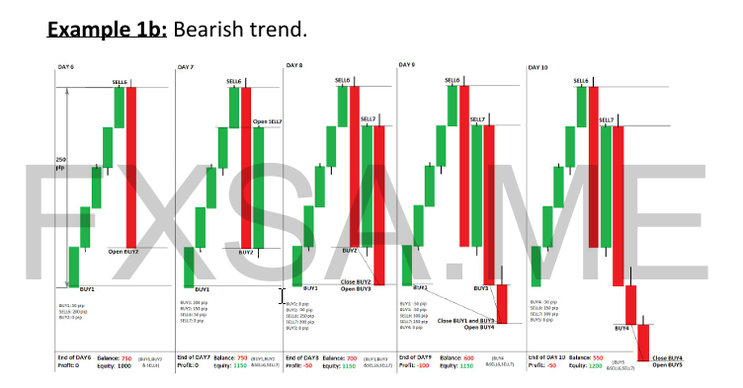
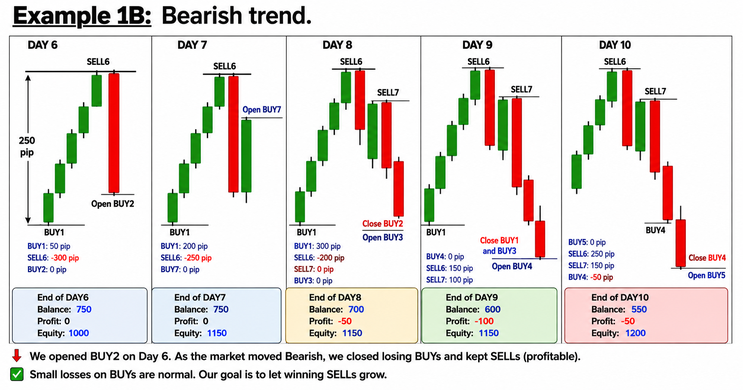
Example 1B — Bearish Reversal Scenario
DAY 7B
The market initially behaves like Example 1A
Current positions
BUY1
BUY2
SELL6
Everything remains manageable
DAY 8B
A strong bearish candle confirms a possible reversal
Current situation
BUY2 turns negative
SELL6 becomes strongly profitable
Actions
Close BUY2
Keep BUY1 open temporarily
Open BUY3
The strategy still maintains exposure on both sides until the new direction becomes clearer
DAY 9B
The bearish movement continues
Current situation
BUY1 becomes weak
BUY3 turns negative
SELL positions continue gaining profit
Actions
Close BUY1
Close BUY3
Open BUY4
The bearish trend is now becoming dominant
DAY 10B
Another bearish candle closes
Actions
Close BUY4
Open BUY5
SELL positions continue accumulating profits while losing BUY positions are replaced daily
Result of Example 1B
In a bearish reversal the SELL positions begin accumulating profit while losing BUY positions are progressively removed
The strategy adapts automatically to the new market direction without requiring prediction
The system naturally transitions from bullish exposure into bearish trend accumulation
Key Insight
Example 1A demonstrates how the strategy behaves during a strong bullish continuation
Example 1B demonstrates how the strategy adapts when the market reverses direction
In both situations winners are allowed to grow while losers are controlled daily
The strategy focuses on equity growth rather than trying to predict future price direction
16# Mouteky Method Trading System
Trend line Trading System
Submit by JanusTrader
The first step to trend line construction, and most important, is the selection of the two points to create the trend line with. As I stated above, when pursuing to construct a trend line we must read like the Japanese, from right to left. All trend line analysis will be done on the four hour chart compression. By process of elimination of all chart compressions, I
have concluded that only the four hour compression is needed. The four hour compression generates less trend line breaks and more accurate price projections than any other time compression. All analysis shown of trend lines will be conducted of the four hour compression. In order to create a trend line, it is necessary to locate the two points to create the trend line. In this example we will be talking about a demand trend line (uptrend). An uptrend is created when demand exceeds supply; this is where the name demand line is derived from. When choosing the points to create a demand line we are focusing on points of support.
True points of support are only those which low has two candles to the left of it and two candles to the right of it which lows do not exceed the low you are using. See the examples below for reference of true support points.
In order to create a trend line, it is necessary to locate the two points to create the trend line. In this example we will be talking about a demand trend line (uptrend). An uptrend is created when demand exceeds supply; this is where the name demand line is derived from. When choosing the points to create a demand line we are focusing on points of support.True points of support are only those which low has two candles to the left of it and two candles to the right of it which lows do not exceed the low you are using. See the examples below for reference of true support points.
In the chart above, I have marked the two points that will be used to create the demand line, remember only two points are used to create our trend lines. Notice how I refer to the most recent point of support on the chart as the 1stst point, remember we trade the most dynamic market in the world, right to left is the key. To find the second point of the demand line we look for the very next point of support that has two candles to the left and two to the right that do not exceed the low of the support point.
In the pictures Moutekey Method forex system in action.


Once we have created of trend line, our next step is to use this trend line to create a downside price projection once the market opens a candle on the four hour chart below the demand line. Note I only say once the market opens a candle, mentioned nothing about close because only the open of a candle is necessary to create the price projection. The price projection is created this way; you take the highest high created above the demand line and mark it with a vertical line. As pictured in the example below:


Next you need to take a horizontal line and mark the point where the vertical line coming from the highest high recorded above the trend line intersect with the trend line. What seems complicated at first will be much easier observed and understood in the example below.Note
Note the two values listed on the chart. In the next step we take the difference between the highest high recorded above the demand line and the point where the demand line is intersected by the vertical line.
Highest High 1.9146
Point of intersection 1.8960
0.0186
We get a difference of 186 pips. This number becomes our price projection. The final step in the process is the point of application of the price projection. The price projection will be 186 pips to the downside oncea four hour candle has opened below the demand line. It is key to become accustomed to this technique because price usually reacts quickly to the downside once a candle has opened beneath the demand line. Valuable pips will be lost if the trader does not react quickly in many cases.
Trendline Forex strategies
22# Trendline Scalper - Forex Strategies - Forex Resources -
78# Advanced Trendline Scalping Strategy - Forex Strategies ...
Trendline Metatrader indicator - Forex Strategies - Forex Resources ...
6# Trend line Breakout and Fibonacci - Forex Strategies - Forex ...
116# Trendline Forex Entry Signal, Two High Probability Setups ...
104# Tom De Mark Trend line Strategy - Forex Strategies - Forex
38# Trendline Breakout - Forex Strategies - Forex Resources -
61# Momentum and Demark Trend line - Forex Strategies - Forex ...
119# Sperandeo Victor, Trendline Method - Forex Strategies -
312# Instant Trendline forex Strategy - Forex Strategies - Forex ...
8# Trendline Candelstick pattern with Fibo - Forex Strategies -
117# Trendline System - Forex Strategies - Forex Resources -
189# Instant Trendline Filter Scalping - Forex Strategies - Forex ...
Forex Books about trend line e pattern. - Forex Strategies - Forex ...
16# Mouteki System - Forex Strategies - Forex Resources - Forex ...
DeMark Metatrader Indicator - Forex Strategies - Forex Resources ...
2# Tom Demark FX system - Forex Strategies - Forex Resources ...
14# DeMarK System - Forex Strategies - Forex Resources - Forex


Write a comment