


41# Adaptive SNR with Bollinger Stop
Alexander 2026
The Adaptive SNR System Indicator with a Bollinger Bands–based stop system to create a disciplined trend-following approach. The purpose of the strategy is to trade only in the direction of the dominant market trend while using adaptive support and resistance zones to obtain precise entries and logical exits.
The method is designed to produce structured decisions, controlled risk, and consistent trade management. Instead of relying on subjective chart interpretation, the trader follows a clear process that integrates market structure and dynamic trend control.
Strategy Overview
The strategy uses two complementary tools. The Adaptive SNR indicator provides structural information about the market, while the Bollinger Bands Stop indicator defines the trend direction and manages trade exits.
The Adaptive SNR System Indicator automatically identifies price zones where significant reactions previously occurred. These areas represent potential support and resistance and often become locations where price may react again. The indicator highlights zones rather than single price levels, which reflects the way markets actually behave.
The Bollinger Bands Stop indicator acts as a trend filter and dynamic stop system. It shows whether the market is trending upward or downward and provides a technical reference for stop-loss placement and trailing exits.
Together, these indicators create a balanced framework where structure defines entries and trend defines direction.
Indicators Configuration
The Adaptive SNR indicator is used to identify structural areas in the market. These zones include major support areas, resistance areas, breakout locations, and potential retest levels. The indicator automatically adapts to price movements and volatility, allowing the trader to work with updated market structure.
The Bollinger Bands Stop indicator is configured with a period of 15, a deviation of 2, and a stop factor of 1.0. Risk per trade is defined as a fixed percentage of account capital.
This indicator determines whether the market is bullish or bearish and provides a dynamic stop reference that adjusts as price moves.
Trading Philosophy
The core idea of the strategy is straightforward. Positions are opened only in the direction of the prevailing trend.
When the Bollinger Bands Stop indicates a bullish environment, only buy trades are considered. When the indicator shows a bearish environment, only sell trades are allowed.
Trading against the trend is avoided because counter-trend positions generally carry lower probability and higher risk. Following the dominant direction helps maintain consistency and reduces unnecessary losses.
Identifying the Market Trend
A bullish trend is defined by price remaining above the Bollinger Bands Stop line while the stop line itself moves upward. In this environment the market typically produces a sequence of higher lows and higher highs, indicating sustained buying pressure. Under these conditions the trader focuses exclusively on long opportunities.
A bearish trend is defined by price remaining below the Bollinger Bands Stop line while the stop line slopes downward. The market structure usually shows lower highs and lower lows, indicating persistent selling pressure. In this situation the trader concentrates only on short positions.
Long Trade Procedure
The first step is confirming that the market is trending upward according to the Bollinger Bands Stop indicator. Price must be positioned above the stop line and the stop line should be rising.
After the trend is confirmed, the trader waits for a pullback. Entering trades in the middle of a movement is avoided because it increases risk and reduces potential reward. Instead, price is allowed to retrace toward an Adaptive SNR support zone.
When price reaches a support zone, the trader looks for evidence that buyers are returning to the market. Confirmation may appear as a strong bullish candle, a clear rejection wick, or renewed upward momentum.
Once confirmation is present, a buy position can be opened.
The stop loss is placed at a logical technical location. This is typically below the support zone or near the Bollinger Bands Stop level. The objective is to position the stop where the trade idea becomes invalid rather than using arbitrary distances.
Profit targets are determined using structural or dynamic methods. One approach is to aim for the next resistance zone identified by the Adaptive SNR indicator. Another method is to use a predefined risk-to-reward ratio such as one to two or one to three. A third option is to allow the Bollinger Bands Stop to trail the position until the trend ends.
Short Trade Procedure
The process for short trades follows the same logic in the opposite direction.
The trader first confirms that the Bollinger Bands Stop indicates a downward trend. Price must be below the stop line and the stop line should be moving downward.
After the trend is established, the trader waits for price to retrace upward toward an Adaptive SNR resistance zone. Selling at market lows is avoided because it exposes the trade to unnecessary risk.
When price reaches a resistance area, the trader looks for signs that selling pressure is returning. Confirmation may include bearish candles, strong rejection from resistance, or renewed downward momentum.
Once confirmation appears, a sell trade can be opened.
The stop loss is positioned above the resistance zone or above the Bollinger Bands Stop level. This ensures the stop reflects the market structure.
Profit targets may be placed at the next support zone, calculated using a fixed risk-to-reward ratio, or managed dynamically using the Bollinger Bands Stop as a trailing exit.
Multi-Timeframe Approach
The strategy becomes more reliable when multiple timeframes are used together.
Higher timeframes such as H4 or Daily charts are used to understand the broader market direction and identify major Adaptive SNR zones. These charts provide the structural context.
Lower timeframes such as H1 or M15 are used to refine entries and observe pullbacks into zones. This allows the trader to enter with better precision and reduced risk.
A typical workflow begins with identifying the main trend on the higher timeframe. Support or resistance zones are then marked. The trader moves to a lower timeframe and waits for price to retrace into one of these areas before entering.
This approach improves timing and reduces false entries.

Trade Management
Once a position is open, the Bollinger Bands Stop indicator can be used as a trailing stop. As the stop line moves, it protects profits while allowing the trend to continue.
Trades may be closed early if the Bollinger Bands Stop changes direction, if price reaches a strong opposing zone, or if the market structure clearly shifts.
Managing trades in a structured way helps reduce emotional decisions.
Example Scenarios
In a typical long trade, the Bollinger Bands Stop confirms an upward trend and price retraces into a support zone identified by the Adaptive SNR indicator. A bullish reaction forms, a buy position is opened, and the stop is placed below support. The position is managed until price reaches resistance or the trailing stop is triggered.
In a typical short trade, the Bollinger Bands Stop confirms a downward trend and price retraces into a resistance zone. A bearish reaction appears, a sell position is opened, and the stop is placed above resistance. The trade is held until price reaches support or the trailing stop closes the position.
Advantages of the Method
This approach creates a structured trading process where every decision follows clear rules. The combination of market structure and trend filtering reduces uncertainty and improves consistency.
Trading in the direction of the trend increases the probability of success because positions align with the dominant market movement.
Adaptive SNR zones provide logical entry areas, while the Bollinger Bands Stop offers objective stop placement and exit management.
Risk becomes easier to control because trades are based on defined technical levels rather than emotional decisions.
Final Considerations
The Adaptive SNR and Bollinger Bands Stop combination forms a practical and disciplined trading framework.
The Adaptive SNR indicator defines where trades should occur, while the Bollinger Bands Stop defines when trades should occur.
Success with this method depends on patience and consistency. The trader must wait for price to reach structural zones and avoid forcing trades when conditions are not aligned.
When applied with proper risk management, this strategy can provide a clear and repeatable approach to trend trading.
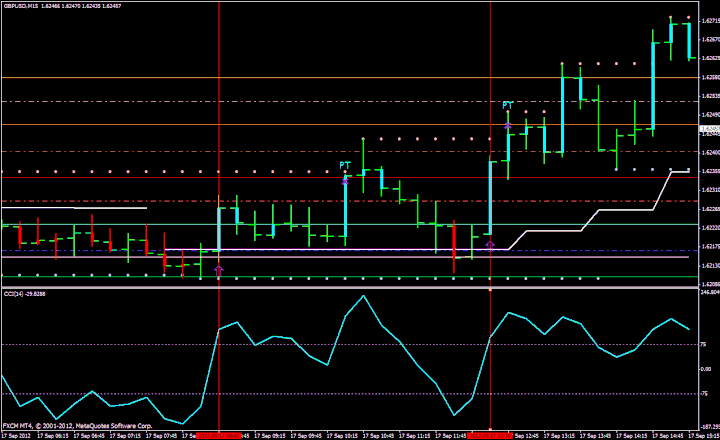
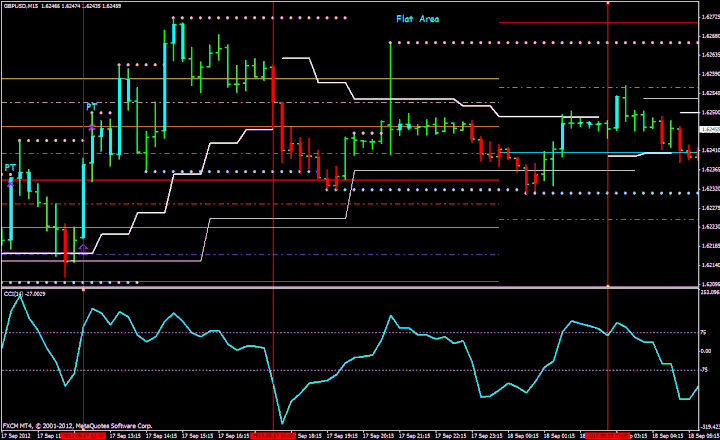
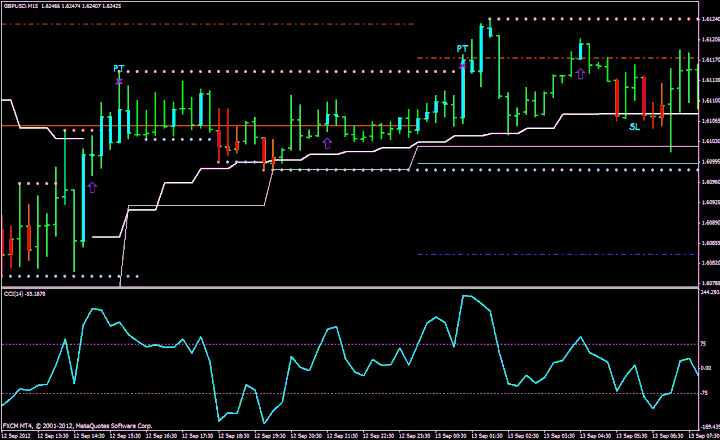
41# Support and Resistance with CCI Trading System
Submit by Maximo Trader 19/09/2012
Time Frame 15 min;
Currecncy pairs:any.
Indicators:
CCI Custom Candle;
Support and Resistance;
MTF Trend envelopes 240;
MTF Trend envelopes 60;
All Pivots;
CCI 14 (leve buy 75, level sell -75);
Rules
Trade only in the direction of the trend.
Long Entry:
CCI Custom Candle Acqua, MTF Trend envelopes 240 an 60 below the candles,
CCI14 above the level 75.
Short Entry
CCI Custom Candle red, MTF Trend envelopes 240 an 60 above the candles,
CCI14 below the level – 75.
Exit positions:
3 options
On the pivot levels
with profit target predetermined, depends by currency pairs.
3 pips before level suppor or resistance.
Place stop loss: 5 pips above or below MTF trend envelopes 60.
Exit positions:
3 options
On the pivot levels
with profit target predetermined, depends by currency pairs.
3 pips before level suppor or resistance.
Place stop loss: 5 pips above or below MTF trend envelopes 60.
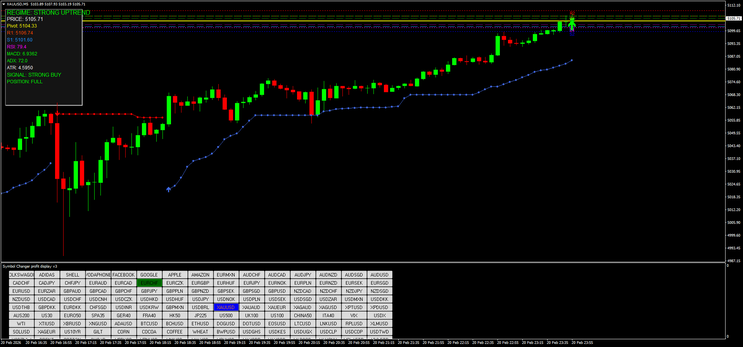
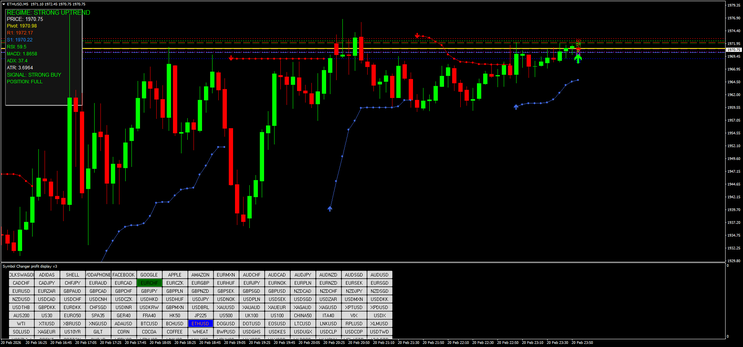
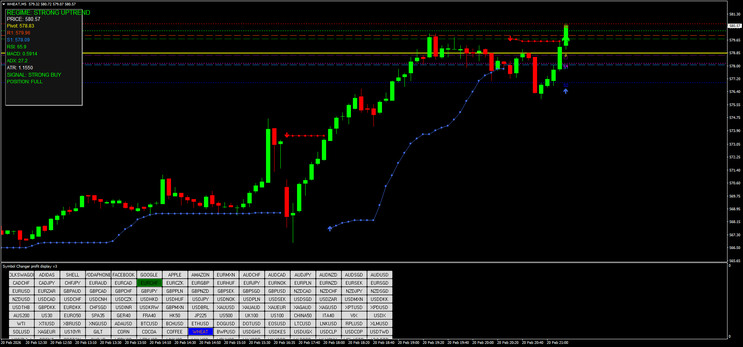
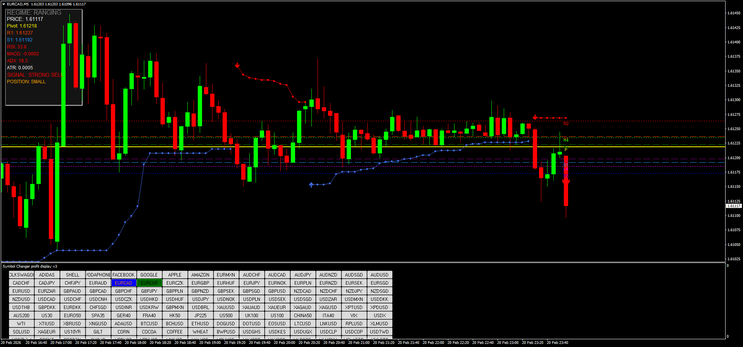
In the pictures Support and Resistance with CCI forex system in action.
Trading System: CCI with support and Resistence, Trend envelopes.
Support and Resistance Forex Strategies
4# Simple Support and Resistance Strategy - Forex Strategies ...
36# Tutorial Support and Resistance - Forex Strategies - Forex ...
5# Support and Resistance important or psycho level - Forex ...
23# Fibnacci Support and Resistence - Forex Strategies - Forex ...
12# SRDC Method Level III - Forex Strategies - Forex Resources ...
9# SRDC Method Level I - Forex Strategies - Forex Resources ...
11# SRDC Method Level II with Fibo - Forex Strategies - Forex ...
8# Fibonacci Fan - Forex Strategies - Forex Resources - Forex ...
37# Trade Zone Tutorial - Forex Strategies - Forex Resources ...
http://www.learn-forextrading.org/2017/06/super-aggressive-reversal-trading-system.html
http://www.learn-forextrading.org/2014/11/trade-break.html
http://www.learn-forextrading.org/2017/06/trendline-pullback.html
CCI Forex Strategies
107# CCI, MACD, Zig Zag - Forex Strategies - Forex Resources ...
49# CCI and Stochastic Retracement - Forex Strategies - Forex ...
CCI Metatrader Indicator - Forex Strategies - Forex Resources ...
10# CCI Stochastic and MACD - Forex Strategies - Forex
58# CCI Floor Forex - Forex Strategies - Forex Resources - Forex
72# CCI Explosion - Forex Strategies - Forex Resources - Forex ...
93# CCI Trend Strategy - Forex Strategies - Forex Resources -
45# CCI and EMA - Forex Strategies - Forex Resources - Forex ...
34# CCI Floor Forex II - Forex Strategies - Forex Resources - Forex
208# Gann, CCI and MACD - Forex Strategies - Forex Resources ...
356# Trading 50 cci - Forex Strategies - Forex Resources - Forex ...
248# CCI Strategy - Forex Strategies - Forex Resources - Forex ...
187# 10 pips a day with CCI and MACD - Forex Strategies - Forex
45# CCI and EMA - Forex Strategies - Forex Resources - Forex ...
211# Scalping with 200 CCI - Forex Strategies - Forex Resources ...
302# CCI 50 Strategy - Forex Strategies - Forex Resources - Forex
9# Breakout With CCI - Forex Strategies - Forex Resources - Forex
148# Fx Sniper's Ergodic CCI System - Forex Strategies - Forex ...
16# CCI System - Forex Strategies - Forex Resources - Forex ...
