498# Heiken Ashi RSI Trend Trading System
Heiken Ashi Trend Trading System
Submit by Jeff 09/10/2013
Time Frame 15 min, 30 min, 60min
Currency pairs:major.
Metatrader indicators:
Entry, Entry signal and Trend;
RSI Indicator: Period of 3 with a 50% line added;
Slow Stochastic indicator: (8,4,4) K-period 8, D-period 4, Slowing 4 / Colors: Red (slow line) and Green (fast line);
Heikin Ashi Candlesticks - The Heikin-Ashi technique is extremely useful for making candlestick charts more readable--trends can be located more easily, and buying opportunities can be spotted at a glance.
Heiken Ashi RSI Trend Trading System Rules
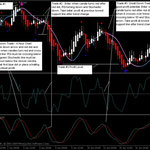
Down (Short) Trade:
1. Look for pink Down Trend Arrow. This indicates that it is the beginning of a trend change for that time frame. Best if all charts are doing the same. Theoretically, if only one chart is being played (preferably a higher chart such as a 4 hour as it would tend to fluctuate less), then you could place a trade either up or down, depending on the trend arrow. But be aware that the market could still move up or down bringing the arrow with it. What I like about looking at all the charts is that it makes your entry more accurate if all the charts are moving in one direction.
Please note: If one chart is showing a trend arrow in the opposite direction to what you want to trade, (usually a lower chart), have a look at the highest/lowest support or resistance line after the arrow. If the opposite arrow has not come on yet (the direction in which you want to trade) then be aware that the market WILL go up or down past that S/R level UNTIL the opposite arrow comes on. So in other words, if all the arrows are not going in the same direction, the market could easily travel 50 pips or more before it decides to turn around. I've found this out from experience!
2. Look for the Red Dot for possible entry.
3. Enter when candlestick turns Red. Its best if the candle closing is below the trend line. I have on occasion traded when the candle was not closed yet over the trend line, but changing color. If all other factors look good, then yes, I would trade it. It may not result in as many pips or it could result in more pips. It is always best though, to watch this sort of trade until it is well established over the trend line.
4. RSI must be turning down and crossing below the 50 line.
5. The Slow Stochastic green line (fast) must be crossing down below the red (slow) line.
6. Take profit at the first blue dot for initial trade. This becomes the 1st Support level. RSI will be starting to turn up, Stochastic will be changing direction and candlestick may be starting to change colour.
7. Re-enter trade at new red dot and take profit at the previous Support level. For subsequent trades, always enter at red dots or start multiple down trades and take profit at the lowest Support level after the initial trend change. The market may go back and forth a few times first before hitting the target.
8. Exit trades at blue dots, which indicate a direction change OR trail the trade down to the lowest previous support level.
9. Keep placing trades until the opposite Trend Arrow comes on. This will usually be the lowest support level.
10. Stop loss is recommended at previous resistance levels. Use your own judgment. Trailing stops can be used.
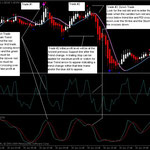
Up (Long) Trade:
1. Look for blue Up Trend Arrow. This indicates that it is the beginning of a trend change for that time frame. Best if all charts are doing the same.
2. Look for the Blue Dot for possible entry.
3. Enter when candlestick turns White. It is best if the candle closing is above the trend line. I have on occasion traded when the candle was not closed yet over the trend line, but changing color. If all other factors look good, then yes, I would trade it. It may not result in as many pips or it could result in more pips. It is always best to watch this sort of trade until it is well established over the trend line.
4. RSI must be turning up and crossing above the 50 line.
5. The Slow Stochastic, green line (fast) must be crossing up above the red (slow) line.
6. Take profit at the first red dot for initial trade. This becomes the 1st Resistance level. RSI will be starting to turning down, Stochastic will be changing direction and candlestick may be starting to change colour.
7. Re-enter trade at new blue dot and take profit at the previous Resistance level.For subsequent trades, always enter at blue dots or start multiple up trades and take profit at the highest Resistance level after the initial trend change. The market may go back and forth a few times first before hitting the target.
8. Exit trades at red dots, which indicate a direction change OR trail the trade up to the highest previous resistance level.
9. Keep placing trades until the opposite Trend Arrow comes on. This will usually be the highest Resistance level.
10. Stop loss is recommended at previous support levels. Use your own judgment. Trailing stops can be used. Note: Lowest or Highest Support/Resistance levels may change and the Arrow may move down or up from initial point where it showed up. Refresh charts often and when all chart times indicate a trade in a certain direction, this is the best time to take the trade. Also, if the Support/Resistance level for take profit is a long ways away, (lots of pips), I will often place multiple limit orders at 20 to 25 pips profit and take profit all the way up or down depending on which way I'm trading. This locks in profit along the way.
Note: Lowest or Highest Support/Resistance levels may change and the Arrow may move down or up from initial point where it showed up. Refresh charts often and when all chart times indicate a trade in a certain direction, this is the best time to take the trade. Also, if the Support/Resistance level for take profit is a long ways away, (lots of pips), I will often place multiple limit orders at 20 to 25 pips profit and take profit all the way up or down depending on which way I'm trading. This locks in profit along the way.