


3# Zone Hunter: The Ultimate Multi-Strategy Trading Indicator
Janus Trader 2026
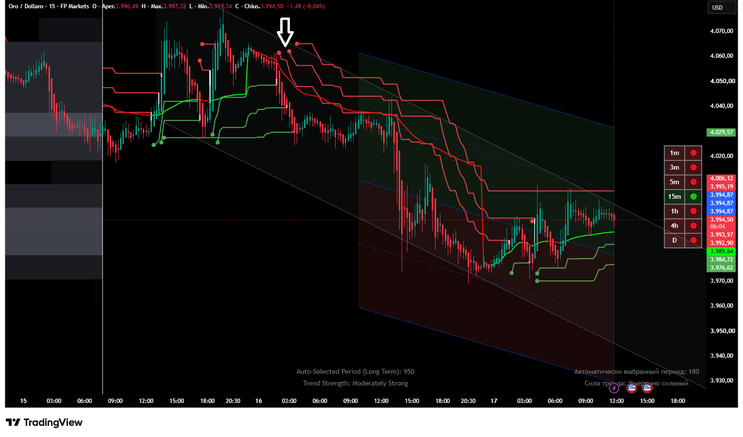
Zone Hunter represents a sophisticated convergence of multiple technical analysis tools designed to provide traders with comprehensive market insights. This powerful indicator combines trend detection, liquidity analysis, statistical modeling, and multi-timeframe confirmation into a single cohesive system that can transform your trading approach.
Understanding the Core Components
Triple Supertrend System
The foundation of Zone Hunter lies in its three-tier Supertrend configuration. Each Supertrend operates with distinct parameters to serve specific purposes in your trading decisions. Supertrend I uses a 7-period ATR with a 2.0 multiplier, providing rapid signals for entry opportunities. Supertrend II employs a 10-period ATR with a 3.0 multiplier, primarily designed for position management and exit signals. Supertrend III utilizes a 14-period ATR with a 4.0 multiplier, establishing the dominant trend direction.
This layered approach ensures that traders receive signals filtered through multiple time horizons, reducing false signals and improving overall accuracy. The system displays buy and sell labels with visual cloud highlighting that changes color based on trend direction, making it easy to identify market momentum at a glance.
Liquidity Heatmap
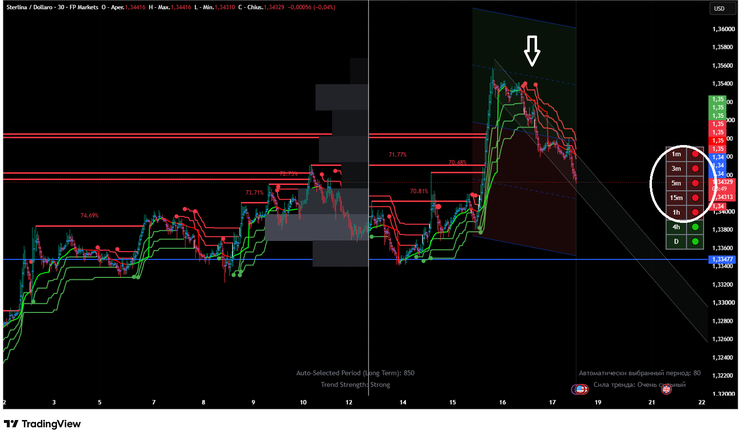
The heatmap component analyzes potential liquidation levels based on historical price action and volume distribution. It calculates leverage-based liquidation zones using a configurable period and leverage multiplier, creating a visual representation of where stop losses and liquidations are likely concentrated.
The Point of Control (POC) line marks the price level with the highest trading volume, serving as a critical reference point for institutional activity. The heatmap uses gradient coloring to indicate volume intensity, with brighter colors representing higher concentration zones. This feature helps traders identify areas where price is likely to react or where significant market moves may originate.
Regression Channel
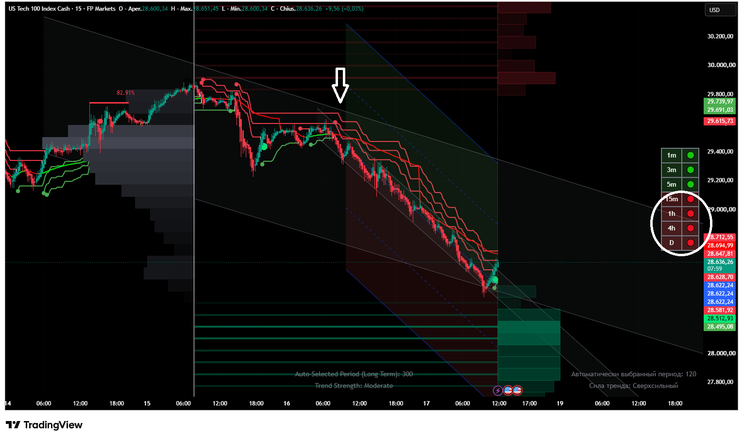
Zone Hunter incorporates a dynamic regression channel that adapts to market conditions using linear regression analysis. The channel can operate in standard or advanced mode, with scaling based on either standard deviation or Average True Range. Users can configure two distinct levels with customizable multipliers, creating upper and lower bands that define the statistical boundaries of price movement.
The regression channel serves multiple purposes: identifying trend direction, spotting potential reversal zones at channel extremes, and providing dynamic support and resistance levels. The channel can extend in various directions and includes fill options for enhanced visual clarity.
Adaptive Trend Finder
The Adaptive Trend Finder represents one of Zone Hunter's most sophisticated features. This component automatically selects the optimal period that demonstrates the strongest trend correlation by analyzing Pearson's R values across multiple timeframes. The system evaluates periods ranging from short-term (20 bars) to long-term (1200 bars) to identify which timeframe currently exhibits the most reliable trend characteristics.
The indicator displays trend strength using descriptive labels ranging from "Extremely Weak" to "Ultra Strong," providing immediate context about trend reliability. For daily and weekly timeframes, the system calculates Compound Annual Growth Rate (CAGR), offering insights into the annualized return potential if the current trend continues.
Pearson's R correlation coefficient measures the linear relationship between price movements and trend projection. Values approaching 1.0 indicate strong positive correlation, increasing confidence in the trend's sustainability based on historical data patterns.
Multi-Timeframe Dashboard
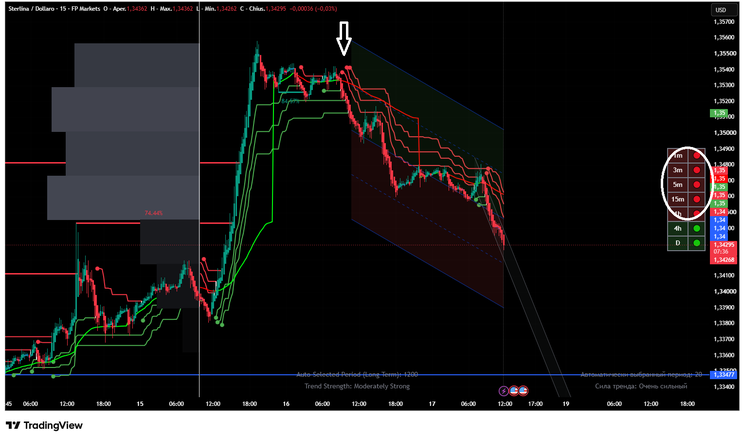
The dashboard component provides instantaneous visibility into trend direction across all major timeframes, from 1-minute to monthly charts. Each timeframe displays an indicator showing bullish, bearish, or neutral conditions, with color-coded backgrounds for rapid assessment.
This feature enables traders to identify alignment opportunities where multiple timeframes move in the same direction. The system includes specific alert conditions for key alignments: 3D-D-4H alignment signals strong long-term trends, D-4H-1H alignment indicates solid medium-term momentum, and 4H-1H-15M alignment reveals short-term trading opportunities. When three or more consecutive timeframes align, the probability of successful trades increases significantly.
Support and Resistance with Probability Modeling
Zone Hunter employs logistic regression to calculate the probability that detected pivot points will function as valid support or resistance levels. The system analyzes pivot highs and lows using a configurable length parameter, then evaluates each level based on RSI conditions and body size relative to Average True Range.
The algorithm tracks how many times price respects each level, with a configurable target respect count determining which levels qualify as significant. Only levels exceeding the probability threshold display on the chart, ensuring that clutter remains minimal while important zones receive clear emphasis.
The system labels retests with "R" markers and breaks with "B" markers, providing visual confirmation of price interaction with key levels. This probabilistic approach separates Zone Hunter from traditional support and resistance indicators by quantifying the statistical likelihood of level effectiveness.
VWAP Divergence Detection
The Volume Weighted Average Price divergence component identifies situations where price action and VWAP move in opposite directions, signaling potential reversals. The system uses a configurable lookback period and ATR multiplier to determine significant divergences, filtering out minor fluctuations that could generate false signals.
Bullish divergence occurs when price makes higher highs while VWAP makes lower highs, suggesting underlying weakness despite apparent strength. Bearish divergence appears when price makes lower lows while VWAP makes higher lows, indicating hidden strength beneath surface weakness. The indicator plots divergence points with distinct markers and includes alert functionality for real-time notification.
Trading Strategy Implementation
Entry Conditions for Long Positions
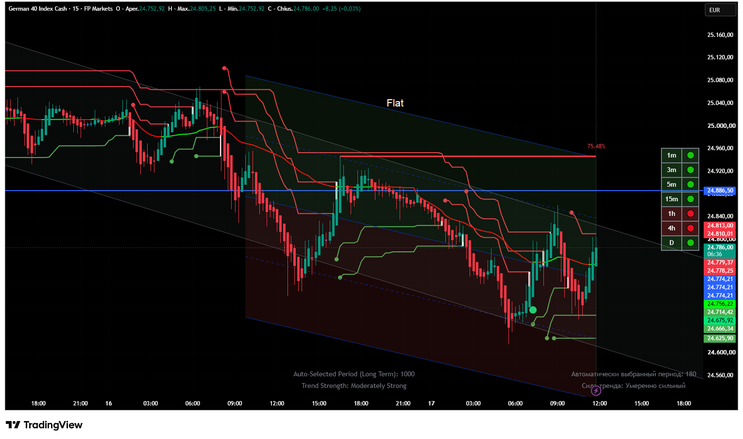
Successful long entries require multiple confirmation signals working in harmony. Begin by checking the multi-timeframe dashboard for alignment, ideally with 4H, 1H, and 15M all showing bullish indicators. Wait for Supertrend I to generate a buy signal, confirmed by the appearance of the green BUY label.
Verify that the Adaptive Trend Finder displays "Moderately Strong" or higher trend strength, with Pearson's R above 0.80 indicating reliable correlation. Ensure price trades above the regression channel midline and ideally bounces from the lower band. Confirm that price sits above key support levels identified by the probability model, with probability percentages exceeding 70%.
Check the liquidity heatmap to ensure entry occurs above the POC line, indicating bullish volume distribution. Finally, look for bullish VWAP divergence or price trading above VWAP for additional confirmation. When six or more of these conditions align, entry probability reaches optimal levels.
Entry Conditions for Short Positions
Short entries follow the inverse logic of long positions. The dashboard should show bearish alignment across 4H, 1H, and 15M timeframes with red indicators. Supertrend I must display the red SELL label. The Adaptive Trend Finder should indicate strong bearish momentum with high Pearson's R values.
Price should trade below the regression channel midline, preferably rejecting from the upper band. Resistance levels identified by the probability model should cap price action above. The liquidity heatmap should show price below the POC, and VWAP should either display bearish divergence or trade above price.
Risk Management Protocol
Position sizing should account for the distance between entry and the nearest support or resistance level. Place stop losses below the most recent swing low for long positions or above swing highs for shorts, with minimum distances of 1-2 ATR to avoid premature stops.
Take profit targets should align with identified liquidity zones, regression channel extremes, and probability-based support resistance levels. Consider scaling out at three distinct levels: first target at 1.5R, second target at 3R, and final target at 5R or the next major liquidity zone.
Exit positions immediately if Supertrend II generates a contrary signal, indicating potential trend exhaustion. Close all positions if Supertrend III reverses, as this signals a fundamental shift in the dominant trend.
Timeframe Selection Guidelines
Scalpers should focus on 1-5 minute charts, primarily using Supertrend I and II signals while monitoring the 15M, 1H, and 4H dashboard alignment for directional bias. Take quick profits at 1-2% moves and maintain tight stops.
Intraday traders achieve optimal results on 15-minute to 1-hour charts, utilizing all three Supertrends and requiring full dashboard confirmation. Target 2-5% moves with stops based on structural levels.
Swing traders should operate on 4-hour and daily charts, emphasizing Supertrend III and Adaptive Trend Finder signals. Dashboard alignment on daily, 3-day, and weekly timeframes provides the strongest signals. Target 5-15% moves with wider stops that account for increased volatility.
Advanced Features and Customization
Zone Hunter offers extensive customization options allowing traders to adapt the indicator to their specific trading style and market conditions. All visual elements include transparency controls, color selection, and line style options. The heatmap calculation period, leverage multiplier, and step levels can be adjusted to match the volatility characteristics of different instruments.
The regression channel supports multiple extension modes, allowing traders to project levels into the past, future, or both directions. The Adaptive Trend Finder can operate in short-term or long-term channel modes, with the ability to load the indicator twice for simultaneous viewing of both timeframes.
Alert functionality covers all major signal types: Supertrend crossovers, support and resistance retests and breaks, VWAP divergences, and multi-timeframe alignments. This enables automated monitoring and ensures no opportunity passes unnoticed.
Conclusion
Zone Hunter represents a comprehensive solution for traders seeking institutional-grade analysis tools. By combining trend detection, statistical modeling, liquidity analysis, and multi-timeframe confirmation, the indicator provides the contextual information necessary for high-probability trading decisions.
Success with Zone Hunter requires patience and discipline. Wait for multiple confirmations before entering positions, respect the risk management protocols, and understand that no indicator provides perfect signals. The strength of Zone Hunter lies in its ability to filter noise and highlight high-quality opportunities where multiple analytical methods converge.
Whether you trade cryptocurrencies, forex, or traditional markets, Zone Hunter adapts to your needs while maintaining the analytical rigor demanded by serious traders. Master its components, understand their interactions, and let the data guide your decisions toward consistent profitability.

3# THE CI System
Submitted by staff ForexStrategiesresources
Set up your charts:
Add a red 5 ema line (5 period exponential moving average)
Moving Average, type in 5, choose exponential and apply to close.
Repeat the steps for a 13 ema line (blue)
Add 15, 3, 3 Stochastic Oscillator (close) on the 15 min chart
Add 15, 3, 3 or (8, 3, 3) Stochastic Oscillator (close) on the 60 min chart
Before you commence trading, draw in these lines
• Horizontal and diagonal trendlines through important recent highs and lows on the one hour chart
• Use the Fibonacci drawing tool to draw in important horizontal Fibonacci lines. Select the Fibonacci drawing tool. (see Fibonacci section above).
Determine the Trend
The trendlines and chart patterns on the 1 hour chart will quickly show you the main trend direction for day trading. Trade in the direction of the 1 hour trend. Additional clues may be found on 4 hour and daily charts by looking at Japanese Candlestick patterns and the direction of the market..
FOR BUY
Primarily, look for an entry signal on the 15minute chart .If you don‘t see an entry pattern there, you may be able to see one on the 30minute chart
Find the entry
Intra day traders look for a bullish engulfing candle on the 15 minute chart. (An engulfing candle is where the body of the latest candlestick engulfs the body of the body of the previous candlestick.) Poetic engulfing candlesticks are fine too as the open of the
latest bar should equal the close of the previous bar but may differ slightly on our charts. Alternatively, you can enter a trade at a morning star .You can enter as soon as the bullishengulfing candle pattern or morning star pattern looks like it will stay there
until the 15minute candlestick closes or you can wait a bit longer for confirmation from the 15, 3, 3 Stochastic indicator. Buy when the %K line crosses above the % D line. Check the 30minute chart for an entry pattern if there isn‘t one on the 15minute chart.
Euro 15 minute
Two CI System entry point are shown in the chart. Both involve Bullish Engulfing bars and 15, 3, 3 Stochastic crosses
A second chance but slightly worse entry comes a bit later if you hesitated at the first entry signal. This is a 15minute bullish candlestick with confirming stochastic signal followed by the red 5ema line crossing above the blue 13ema line on another chart
the 5minute chart. Do not try to trade 5minute candlestick patterns. The 5minute chart is only for exponential moving average crosses and isn‘t essential for use if you trade the 15minute or 30minute Candlestick patterns in a timely manner.
Euro 5 Minute
This chart is for the same trade as shown in the 15 minute chart above. The 5/13 ema crosses are indicated by the red ovals. The vertical green lines mark the time of the Bullish Engulfing as seen on the 15 minute chart above
3. Longer term swing traders can find good CI entries on a 60 minute chart. It is possible to enter before the 60 minute candle has closed. Sometimes waiting until the candle has closed would not be appropriate because price has moved too far way from your stop loss point and it would not be worth risking that many pips.
Euro 60 minutes
Two examples of Bullish Engulfing Candles for
—Buys“. —In the first example, the trade would be best placed before the hour period is complete and at the point of engulfing
Stop Loss
1. On a 15minute chart, a stop loss may be placed 10 pips below the low in a 3 bar turning point. The optimum position for the
stop is 10 pips below the low at —1“.
EURUSD 15 min
Try to target at least 1.5 times your stop loss when possible. Exit at one of the following points. Double top, trendline bounce,
161.8% Fibonacci extension 200% extension. Sometimes price will reverse 5 or 10pips before reaching these targets.
38.2%, 50%, 61.8% and 76.4 % retracements of a previous significant move can also be exits.
FOR SELLS (SELLS ARE THE REVERSE OF BUYS)
Entry
1. Look for a bearish engulfing candlestick on the 15 minute chart. (An engulfing candle is where the body of the latest candlestick engulfs the body of the body of the previous candlestick.) Poetic licence engulfing candlesticks are fine too as the open of the latest bar should equal the close of the previous bar but may differ slightly on our charts. Alternatively, you can enter at an evening star. You can enter as soon as the bearish engulfing candle pattern or evening star pattern looks like it will stay there until the 15minute candlestick closes or you can wait a bit longer for confirmation from the 15, 3, 3 Stochastic indicator.
(Sell when the %K line crosses below the % D line.)check the 30minute chart if you can‘t see an entry pattern on the 15minute
chart.
2. Longer term swing traders can also find good CI entries on a 60 minute chart. It is possible to enter before the 30 minute or 60 minute candle has closed. Sometimes waiting until the candle has closed would not be appropriate because price has moved too
far way from your stop loss point and it would not be worth risking that many pips.
Stop Loss
1) On a 15 minute chart, place a stop loss 15 pips above a 3 bar pivot. The optimum position for the stop is 15 points above the high at point —1“ where the entry is as a result of the lower high, bear engulfing and stochastics cross.
GBPUSD 15 min
Exit
Try to target at least 1.5 times your stop loss when possible. Exit at 4 of the following pips.
Double bottom, trendline, 161.8% Fibonacci extension, 200% Fibonacci extension. Sometimes price will reverse 5-10pips before
reaching one of these points.
38.2%, 50%, 61.8% or 76.4% retracements of previous significant moves can also be exits.
Notes:
Supplementary trades apart from CI trades may be taken using other candlestick patterns, 3rd touch of trendlines, 1234 (ABCD)
trades, double tops, double bottoms, higher lows on 1 hour charts, lower highs on 1 hour charts, triangle breakouts, wedge
breakouts, etc. This deviates from the system and is an option for the more experienced traders who use their own judgment and
experience.
Putting It All Together
Do not prejudge the market by saying the market is quiet and won‘t do much. Wait for the trades to come to you. Look at other candle patterns as well and enter trades. If you can trade with patience and discipline (sticking to the rules), you are well on the
way to success. To gain confidence with live trading and your system, it is mandatory that you paper trade or trade on a demo first before you risk your money. Back test to see the high percentage of winning trades. When you see the method working successfully over and over, you will gain the necessary confidence. By using multi-time frame analysis, a trader can find frequent entry setups. See it, believe it and trade it. Don‘t say —it can‘t go lower“ or —it can‘t go higher“.
Keep monitoring the 15 minute, 30minute, 1 hour and 4 hour charts to see what is going on. This gives a good road map of what is happening in the market. If you can‘t see something with those, then there‘s really nothing going on and is best to sit on the
sideline waiting. Keep drawing Fibonacci lines and trend lines.
When a currency pair is moving strongly, there will not be any engulfing candles against the trend but there will be a minor retracement. If there is an engulfing candle, there is a high probability that price will retrace to at least 61.8%. After a
retracement, wait for an engulfing candle to re-enter the trade. Keep looking for a new point 3 entry point as explained in the Retracement System above.
Key to time frames on the charts:
M5- 5 minute; M15- 15 minute; M30- 30 minute; H1- 1 hour ; H4- 4 hour.
The methodology we use in the CI System is powerful compared to other mechanical strategies as we look at many factors and
the more we get, the more powerful the resultant move is.
Each time the EURUSD has stopped, reversed or consolidated there has been a good reason for this, i.e. a Fibonacci retracement,
trendline or a chart pattern or a combination of these factors. This is why you must draw all the relevant lines in so there are no rude shocks ahead. For example, price may hit strong resistance at 76.4% retracement on the daily chart and many day traders wouldn‘t be aware of the reason for the resistance because they haven‘t checked the daily chart.
In this example, the Euro traded between the trendlines and Fibonacci 61.8%retracements ignoring the Pivot lines. This illustrates the importance of looking at the big picture and marking in all significant lines.
The CI System can be used on other time frames.
Share your opinion, can help everyone to understand the forex strategy.

384# 30 min TF - Forex Strategies - Forex Resources - Forex ...
Trend following Forex Strategies
41# Support and resistance with cci - Forex Strategies - Forex ...
78# Trend Following - Forex Strategies - Forex Resources - Forex ...
83# 3 EMA's Forex Trading System
124# Braydensgrail - Forex Strategies - Forex Resources - Forex ...
14#DOSR - Forex Strategies - Forex Resources - Forex Trading-
5# Engulfing Noise Scalping - Forex Strategies - Forex Resources
6# Bullish Engulfing Pattern - Forex Strategies - Forex Resources
7# Bearish Engulfing Pattern - Forex Strategies - Forex Resources
10# Bullish Engulfing" and "Bearish Engulfing pattern with RSI ...
