


15# How to Use the Machine Learning RSI in Trading
Machine Learning RSI – AI Classification & Ranking for Market Regimes
Author of the code Zeiierman
Emiliano Quantitative Trader 2026
The Machine Learning RSI (ML‑RSI) converts RSI into a regime‑based momentum classifier. Instead of reading a traditional oscillator, you interpret market states, momentum strength, and AI‑filtered timing signals. This guide focuses only on how to use it in real trading.
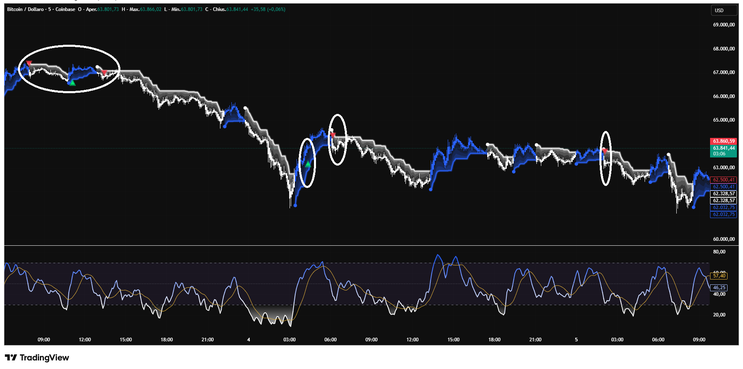
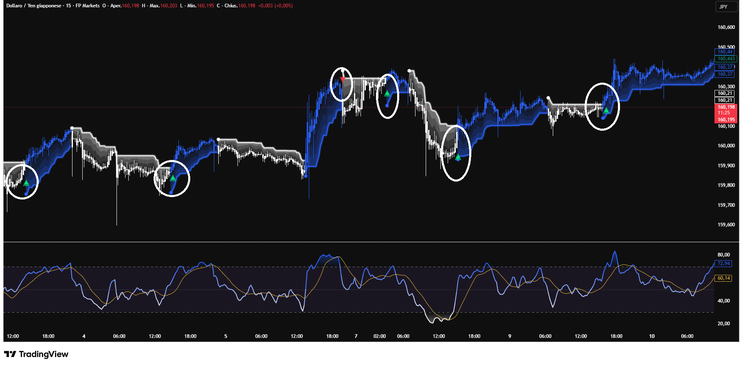
The Supertrend defines the direction. When it is green, the system allows long setups only. When it is red, the system allows short setups only. This directional filter is the foundation of the entire method and should never be ignored.
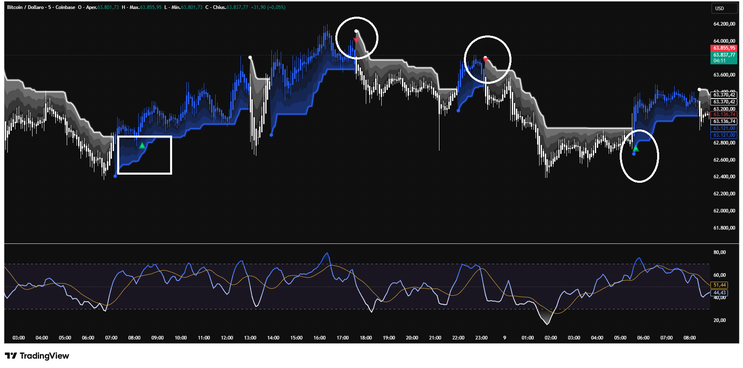
Arrows provide timing. Each arrow marks an AI‑detected transition in momentum and classification. They anticipate regime shifts and appear only when the internal rank and confidence reach the required quality. Arrows are not standalone entries. They are valid only when they agree with the Supertrend direction. A long arrow with a green Supertrend is valid. A short arrow with a red Supertrend is valid. Any arrow against the Supertrend should be ignored.
The ML‑RSI line shows regime strength. Values above 50 indicate a bullish environment. Values below 50 indicate a bearish environment. Values above 70 signal strong expansion, while values below 30 indicate strong compression. This line confirms the environment but does not generate entries.
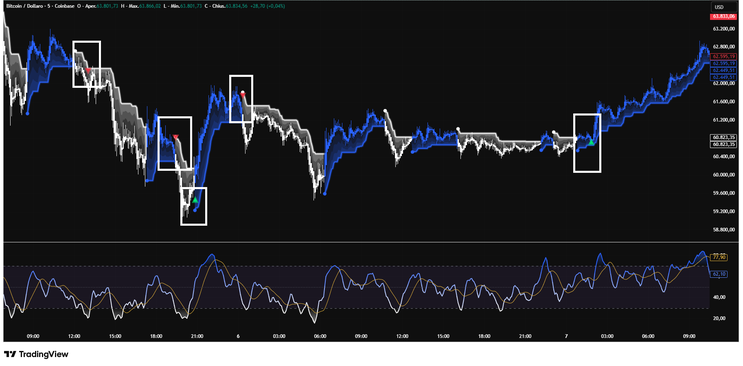
The ranking system evaluates the quality of each signal. Rank measures the structural strength of the setup. Confidence measures the model’s conviction. If either value is low, the signal should be skipped. This prevents entries during choppy or low‑quality conditions.
A long setup requires a green Supertrend, an ML‑RSI line above 50 or rising, a long arrow, and acceptable rank and confidence. A short setup requires a red Supertrend, an ML‑RSI line below 50 or falling, a short arrow, and acceptable rank and confidence. When all conditions align, the entry is statistically stronger and more stable.
Exits are simple. The Supertrend acts as a trailing stop. The position is closed when the Supertrend flips. Partial profits can be taken at volatility bands or structural levels, but the core logic remains tied to the Supertrend.
There are a few things to avoid. Do not trade arrows alone. Do not counter‑trade the Supertrend. Do not treat ML‑RSI like a classic RSI. Do not take signals with low rank or low confidence. The system is designed to be selective and disciplined.
In summary, the Supertrend provides direction, the arrows provide timing, the ML‑RSI line provides regime strength, and the ranking system provides signal quality. Trades should be taken only when all four elements align. This is the most efficient and reliable way to use the Machine Learning RSI.

15# William's Percent Range Trading System
Submit by Forexstrategiesresources
Pair: ANY
Time frame: 1H, 4H, daily.
Strategy based on RLW (William's percent range ) indicator.
Indicators:
Willian's percent range 28
BUY
condition:
Price crosses upwards Level -20 (WPR) and MACD>0
SELL condition:
Price crosses down Level -80 (WPR) and MACD<0
Exit two options:
When MACD crosses line;
Target Profit:4H time frame 60 pips EUR/USD, 70 pips GBP/USD , USD/CHF 40 pips for Daily time frame200pips EUR/USD , 250 pips GBP/USD, USD/CHF 150 pips (recommended).
In the pictures below William's Percent Range Trading System in action.
Share your opinion, can help everyone to understand the forex strategy.
-
#5
Where can I download this indicator?
-
#4
Just a heads up. In the description it says MACD 24, 36,14...but in the picture it is 24, 36, 18
-
#3
hoe to downlaod it
-
#2
Eine Vorlage wäre schön gewesen ...
-
#1
A template would have been nice...
