


778# Dynamic trading system 2V2
Price acition volume momentum trading
Dynamic Zone trading, Fib pivot with market profile
Sumit by Leon ( author v2vboni, source https://www.forexfactory.com/showthread.php?p=12163189#post12163189 )
Dynamic trading system 2V2 is a strategy based on Dinamic Zone, Fib Pivot, Jurich filter, Market profile.
The purpose of this system is to provide the trader with an exact geography of the market of the security in question, in order to produce the best trading choices. To this end the author provides a series of combined indicators of a certain complexity that will help the trader. It must be emphasized that this system is not suitable for beginners but for experts in trading and metatrader 4. The system in this case is sophisticated but this does not mean that it is difficult. We need to practice a little to learn all the potential of this system that will give you satisfaction. The trading system is multi-style with Pivottian operations filtered by the market profile and trend-momentum, you need to choose one.
Time frame 30 min or higher, even if I have successfully tested low time frames, but it is necessary to follow the rules of the author.
Currency pairs: Majors, Minors, Indices and commodities.
Metatrader 4 Indicators ( here I refer to the author's description.)
Heiken
Ashi ( HA ) Average Price Bars ( APB )
☛ Heiken Ashi based on Price Action Channel (PAC) and
☛ Average Price Line (HA-APB Low + HA-APB High)/2
☛ Fused with MTF mode.
☛ Using a non-lag algorithm
☛ With Jurik Smoothing/Filter and Deviation-Scaled Moving Average (DSMA)
↓
✜ The Price Action Channel (PAC)
─ Provides overall direction near the Price.
─ Reveals periods of consolidation.
─ Reveals periods of volatility.
─ It may Use as an Exit Target or
─ Use as a Trailing Stop Loss
※ Neural Network ─ Hull Moving Average (HMA) & Deviation-Scaled Moving Average
(DSMA)
☛ Uses HMA algorithm but this one is a variation from low-lag to zero-lag and then... fused with the following:
↓
☛ Jurik Filters/Smoothing and custom MA types
☛ Combined with Deviation-Scaled Moving Average Algorithm
☛ Better & Best Formula (Better & APB calculation)
✦ The button text shows the average predicted open price
※ Volume Profile ( VP ) ─ Range
☛ Based on VP - Range indicator by © FXcoder
☛ This is a modified version by v2v (streamlined features) ─ VWAP & PVP (Peak Volume Price) line only
☛ Fused to work with v2v dynamic trading system ─ with Pivot Fibs plus and v2v VWAP indicator
☛ Code optimized to adhere with v2v coding structure (control center ready navigational features)
-
With data source and horizontal bar graph style button selection ( to be added soon )
※ Long & Short Deviation-Scaled Moving Average (DSMA)
Similar to GUPPY indicators in terms of MA values and how it is being used.
☛ With Jurik Smoothing/Filter
☛ Using non-lag Hull Moving Average algorithm
※ PIVOT FIBS plus
☛ This indicator is made and fused version by v2v
☛ Some functions/features are based on - All Pivots indicator by Igor at TrendLabaratory
☛ Pivot Fibonacci ONLY ─ Yearly, Quarterly, Monthly, Weekly, Daily, and H4
☛ With features to navigates using the v2v time frame button switch behavior
☛ Dynamic Open Session/State retention switch behavior
☛ Future Sessions and Previous Session Range
☛ Pivot Fibs pip distance from Pivot Base Price (e.g. Typical, Current Open...etc.)
☛ Weekly High & Low Levels
☛ PVP = Peak Volume Price Line (default Yellow color line). This is based on Volume Profile (without the volume bars)
☛ This indicator works with Volume Profile ( VP-Range ) and VWAP indicator
☛ Forex Fixings ─ Frankfurt and CME Fix ─ fx fixing guides
☛ The One Box Session ( daily <=H4, weekly >H4, monthly >=W1 )
☛ Open Session (Sydney - Tokyo - London - New York). You may need to adjust accordingly with your broker server time (chart time) ─ for
session time guides
☛ Daily Open Trading System (DOTS) method by Dean Malone ─ originally use Current Open base price, but this indicator is also plotted with other Pivot base price calculation (e.g. Typical,
Previous Close, etc.). Note... it uses the Top & Bottom most level line only with extended DOTS level.
☛ Average Range (Daily-Weekly-Monthly) Dash info >>> n-Days(today range), Previous, Weekly and current Price distance to ADR, AWR & AMR High & Low
-
ADR (Average Daily Range)
-
AWR (Average Weekly Range)
-
AMR (Average Monthly Range)
-
With features midpoint range using Pivots (current) and PVP (current or previous)
Pivot Fib Levels:
-
R1 = R38
-
R2 = R61
-
R3 = R100
Pivot Base Price: Typical (default)
Pivot Base Price = (Previous High + Previous Low + Previous Close) / 3
Range = Previous High - Previous low
R38 = Range * 0.382 + Pivot Base Price
※ VWAP fused by v2v
What's new with this VWAP indicator?
☛ Uses Average Range ( ADR/AWR/AMR ) and
☛ Average True Range ( ATR ) values for Shifted VWAP Deviation.
☛ Average Price line = (High + Low) /2
☛ It includes v2v's update speed control feature.
☛ This indicator works with Volume Profile ( VP-Range ) and Pivot Fibs plus indicator
☑ Key Takeaways:
☛ A rising VWAP, and/or the price above the VWAP line, means the price may reflect uptrend move or likely in bullish sentiment.
☛ A rising VWAP, and/or the price below the VWAP line, means the price may reflect downtrend move or likely in bearish sentiment.
☛ Rallies with a declining VWAP are treated as bounces which may likely to fail.
☛ Be more aware of VWAP's current direction... more than closing session price ─if it is above or below the VWAP-within a session or two (e.g. Asian, Euro or U.S. session).
☛ Like any Support & Resistance or Supply & Demand level, the more they are tested, the more likely that it may fail.
☛ Don't rely on VWAP exclusively to determine a trend, since it is only showing a historical average, and not what is happening currently or in the future.
☛ Investors may use VWAP to assess the price they paid for a security/instrument throughout a particular session (e.g. Asian/Europe/NY, daily...etc.), if the price they bought at is higher than
the VWAP, then they may have overpaid. If it is less than VWAP, then they purchased shares at a good price.
☛ The VWAP began as a tool for trading shares/stock on daily setup only. However, in these times there were other investors or traders started to use this more recently with financial instruments
like Currency Futures or Forex pairs as some of the modern algorithms began to optimize this tool to integrate with their trading strategy or algorithms.
☛ Traders and analysts use the VWAP to eliminate the noise that occurs throughout a particular session so they can gauge what prices buyers and sellers are really trading at.
The VWAP gives traders insight into how a security/instrument trades for that day and determines, for some, a good price at which to buy or sell.
✦ If the price is below the VWAP... and the price is rallying back into the VWAP, then it may act as resistance.
✦ If the price is above the VWAP... and the price pullback into the VWAP, then it may act as support.
✦ Wait for the market to start to get a move and have it bounce once or twice off of the VWAP. Once that happens, you know that the market has addressed the VWAP (by checking on a 5-minute up to
30-minute chart).
✦ When the price tries to break above or below the VWAP line, there is usually a
battle between buyers and sellers. If the price tries to break above or below the VWAP level multiple times throughout the day, traders and analysts can see that it is a good price to either buy
or sell. However, some short-term traders like to wait for one side to lose the battle and either go long on a break above the VWAP or short on a break below the VWAP.
☑ Limitations of Using Volume Weighted Average Price (VWAP)
While some institutions may prefer to buy when the price of a security is below the VWAP, or sell when it is above, VWAP is not the only factor to consider. In strong uptrends, the price may
continue to move higher for many days, without dropping below the VWAP at all, or only occasionally. Therefore, waiting for the price to fall below VWAP could mean a missed opportunity if prices
are rising quickly.
☑ Other VWAP trading methodologies
With the above limitations, you may use some other VWAP trading methodologies being used by other traders to minimized missed opportunities or even better... a high probability setup.
✦ MIDAS approach by Dr. Paul Levine
Use the VWAP approach by Jperl (If I'm not mistaken, his name is Jerry Perl), together with Volume Profile indicator.
Others use the anchored approach (sometimes using two VWAP indicators) wherein it anchored the VWAP based on the last significant move or based on sessions (NY session, London session, Asian
session...)
※ Traders Dynamic Zones ( TDZ )
This indicator is a TDI variation known as Traders Dynamic Zones (TDZ)
✔ Fused functions & features below:
☛ Dynamic Zones by Leo ZamanskyPhd. and David Stendahl
☛ Jurik filter - phase, smoothing and
☛ RSI-Trend Strength Index (RSX) by Mark Jurik.
☛ Better & Best Formula (Better & APB calculation)
☛ Uses Hull MA (by Allan Hull) but this one is a variation from Low lag to zero-lag
☛ With Ehler's Deviation-Scaled Moving Average (DSMA)
☛ Divergence - Regular & Hidden divergence (shows inside the indicator window only)
☛ Work speed or update control ─ update on a new bar or use timer control
☛ Smart MTF Mode - update speed feature is not activated while on MTF mode
☛ Recommended TF: H4 & D1 TF
☛ Now, best use with Volumes on Main Chart indicator - recommended for indicator trigger/update action
✔ Dynamic Zones ─ The Dynamic Zone indicator is best explained by describing how it solves a common trading problem.
Extreme investing employs the use of oscillators to exploit tradable trends in the market. This style of investing follows a very simple form of logic: only enter the market when an oscillator
has moved far above or below traditional trading levels. However, these indicator driven systems, lack the ability to evolve with the market because they use fixed buy and sell zones. Traders
typically use one set of buy and sell zones for a bull market and substantially different zones for a bear market.
Herein lies the problem. Once traders begin introducing their market opinions into trading equations, by changing the zones, they negate the system's mechanical nature. The objective is to have a
system automatically define its own buy and sell zones and thereby profitably trade in any market -- bull or bear. Dynamic Zones offer a solution to the problem of fixed buy and sell zones for
any indicator driven systems.
✔ Jurik Filters, Phase, and Smoothing
This TDI version uses JMA's (Jurik Research Moving Average) phase and smoothing calculation. Have you noticed how moving averages add some lag (delay) to your signals? ... especially when price
gaps up or down in a big move, and you are waiting for your moving average to catch up? Wait no more! JMA eliminates this problem forever and gives you the best of both worlds: low lag and smooth
lines.
Ideally, you would like a filtered signal to be both smooth and lag-free. Lag causes delays in your trades, and increasing lag in your indicators typically result in lower profits. In other
words, latecomers get what's left on the table after the feast has already begun. The JMA's improved timing and smoothness will astound you.
JMA is a powerful adaptive tracker that can smooth time series data with a very small lag, no overshoots and no oscillations. The algorithm is stable and avoids the complexities of neural
networks. JMA delivers the best all-around performance for smoothness, accuracy, and timeliness.
✔ Hull Moving Average
There are many types of moving averages, the most basic being the Simple Moving Average (SMA). Of all the moving averages the SMA lags price the most. The Exponential and Weighted Moving Averages
were developed to address this lag by placing more emphasis on more recent data. The Hull Moving Average (HMA), developed by Allan Hull, is an extremely fast and smooth moving average. In fact,
the HMA almost eliminates lag altogether and manages to improve smoothing at the same time.
With TDZ indicator combined with Hull MA variation with Jurik filters, and phase & smoothing that ultimately eliminates lagging.
✔ RSI-Trend Strength Index (RSX)
RSI is a very popular technical indicator because it takes into consideration market speed, direction, and trend uniformity. However, its widely criticized drawback is its noisy (jittery)
appearance. The RSX retains all the useful features of RSI, but with one important exception: the noise is gone with no added lag.
✔ Vertical Horizontal Filter (VHF)
Vertical Horizontal Filter (VHF) was created by Adam White to identify trending and ranging markets. VHF measures the level of trend activity, similar to ADX in the Directional Movement System.
Trend indicators can then be employed in trending markets and momentum indicators in ranging markets.
✔ Deviation-Scaled Moving Average (DSMA)
The new DSMA made by John Ehlers and featured in the July 2018 issue of TASC magazine. The DSMA is a data smoothing technique that acts as an exponential moving average with a dynamic smoothing
coefficient. The smoothing coefficient is automatically updated based on the magnitude of price changes. In the Deviation-Scaled Moving Average, the standard deviation from the mean is chosen to
be the measure of this magnitude. The resulting indicator provides substantial smoothing of the data even when price changes are small while quickly adapting to these changes.
✔ RSI & RSX haDelta
haDelta is a simple formula originally developed and published by Mr. Dan Valcu. The idea behind haDelta is to quantify HA candles. By doing this, one can measure momentum and this is very
important when you use haDelta for reversals. It measures the difference between HA Close and HA Open. Caution: High sensitivity if used.
✔ Divergence - Regular & Hidden divergence
☛ Don't trade with divergence alone... You may need to validate this with your own proven trading edge.
※ Volumes on Main Chart indicator
This indicator is a Fused version of the following indicators... initial version of volumes on the main chart by mladen and Paul Hayes Scalper volatility indicator ported from cTrader
platform.
Added Fused functions & features:
☛ volumes & volatility alerts with optional user-defined values.
☛ auto-adjusted zoom in/out for volume bars and location
☛ automated average volume bars based on daily, weekly and yearly with optional user-defined values
☛ auto-adjusted volume bars thickness
☛ with a hidden navigational switch to hide/unhide volume bars and
☛ added extra .wav alert sound files
Most of these indicators require the Volume on Main Chart indicator wherein it acts like the global control center (indi ON & OFF). Sorry, that is what it is, designed to work
with each other. Like for example TDZ indicator... the Volume on Main Chart trigger the update process once the volatility spikes up based on the last average pip count (e.g. from three
previous bars ─ set TF or example 1-minute candle). And this besides from the normal trigger of set time in minutes or on a new bar.
☝ If v2v system/indicators don't seem to work on your end or found it useless, simply move on as there are literally thousands of other systems/indicators out there . . . and this may not be
ready for you or is not for you!
✌ On how to use the system effectively will depend on your own utmost keen observation (or greater experience), due diligence, understanding, and prerogative. Hence, this may not be recommended
for noobs... especially when using the VWAP & TDZ indicator, and even more with Pivot Fibs plus.
How to use
Ideally...
-
This system is best suited on H4 TF or higher using a Trend following strategy.
-
However, it can be used with Volume Profile ( VP-Range ) indicator which is typically suited for M30 time frame. More so, for Intraday traders.
-
Although this system is currently armed with Pivot Fibs plus indicator which have the PVP (Peak Volume Price, also known as POC ) but without the horizontal volume bars. The Pivot Fibs have features that are visible only from H1 TF down to lower TF.
-
Swing Traders can use the TDZ's dynamic floating levels or zones (band high & low with midpoint) that looks to show OB/S levels. The Pivot Fibs indicator has features that provide an extra confluence in gauging the current trading range.
-
The Heiken Ashi - Average Price Bars (APB) with Price Action Channel (PAC) may act like the cherries on top or icing on the cake in terms of Scalping strategy.
Overall, if you don't consider all/or some of the above information... Simply use the Neural Network HMA-DSMA indicator which requires a little amount of thinking but one must be armed with
trained intuition ; )─
★ The goal is to have a well-informed decision before entering into a trade. Thus, I'm using this system once I have my perceived fundamental bias or understanding and beyond (e.g.
sentiment, qualitative & quantitative analysis...etc).
Trend Momentum Style
Buy
TDZ comes out of the bands, then the blue line crosses upward the other two lines.
HMA DSN crosses above Heiken Aschi APB candle aqua color.
This setup is valid if the price breaks a resistance.
The candle closes above the resistance.
Sell
TDZ comes out of the bands, then the blue line crosses downward the other two lines.
HMA DSN crosses below Heiken Aschi APB candle aqua color.
This setup is valid if the price breaks a support.
The candle closes under the support.
Exit options:
Profit Target at the Fib Pivot level, at the centre of the market profile or with predetermined profit target.
Initial stop loss at the previous swing high/low.
Fib Pivot Style
Buy
Price bounce or broken the lower levels with TDZ that crosses upward.
Sell
Price bounce or broken the higher levels with TDZ that crosses downward.
But you have to look carefully when the price meets the central level of the Market profile.
In pictures Dynamic trading system 2V2 in action.
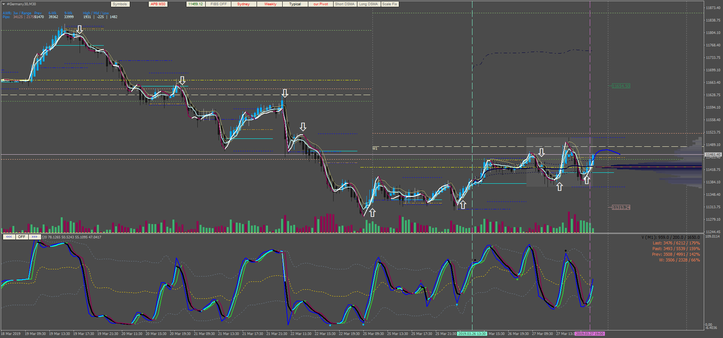
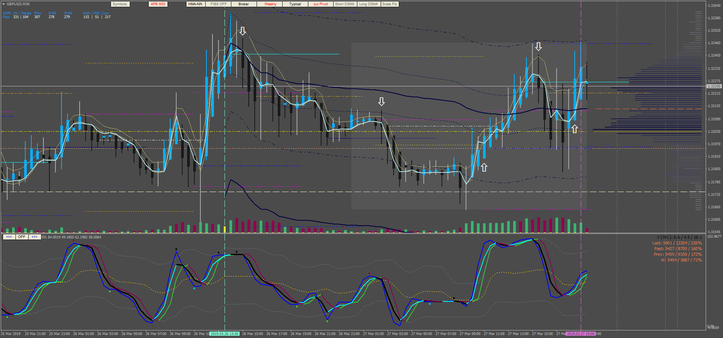
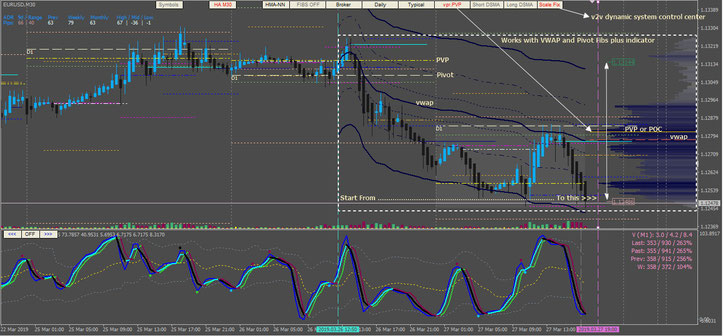
Share your opinion.
