


829# Forex Pip Magnet
JMO Trading System
Momentum, Bands and Volume
Submit by Lorenz
Forex Pip Magnet is JMO Trading System. Forex Pip magnet is a system that I pulled out of my MT4 archive, it is an old trading system but it can be very profitable. Here I show how the authors presented this trading system.
The Pip Magnet is based on these market fundamentals. That’s why it works!
Action
Volume
Price move
Price direction
Now let’s go into the indicators in more detail so you can see when to enter a buy trade, a sell trade and where to exit a trade.
Indicators Explained
BOA
How it works
The BOA draws support(S) and resistance(R) levels on the chart. It refreshes these levels daily. It is good practice to re-deploy the Pip Magnet template daily assuring that you have the latest S & R levels. It takes but a moment, simply right click on the chart and select “Template” > “PIPMAGNET_BOA” or “Template” > “PIPMAGNET_ALL”.
Suggested approach
Load only the PIPMAGNET_BOA template on the chart.
The BOA will alert you that there may be a trade opportunity forming because the price is near an S or R level. Like so:
When the alert occurs, then load the “PIPMAGNET_ALL” template on the chart. This will load the other indicators to help you pick a trade entry point.
This keeps your charts clean and reduces the number of alerts you see/hear.
1st Buy & Sell Signal
When the price hits or is near to one of the S or R levels you will receive an alert.
Note: If a Support level is broken it can become a future resistance level. If a resistance level is broken it plays the role of support for future market moves.
Note: An S&R level is not an exact level – as in being an exact price – S & R levels are areas and some are wider than others.
DD_ELIMINATOR
2nd Buy Signal
When there is a short candle that closes outside the dotted center line of the DD_ELIMINATOR channel at the bottom of the DD_ELIMINATOR channel.
It must be followed by a long candle that closes inside the dotted center line of the DD_ELIMINATOR channel at the bottom of the DD_ELIMINATOR channel.
If the above occurs a green vertical line will appear on the chart. Like so:
2nd Sell Signal
When there is a long candle that closes outside the dotted center line of the DD_Eliminator channel at the top of the DD_Eliminator channel.
It must be followed by a short candle that closes inside the dotted center line of the DD_Eliminator channel at the top of the DD_Eliminator channel.
If the above occurs a red vertical line will appear on the chart. Like so.
The same considerations apply here as described here above.
JMO
3rd Buy Signal
Oversold Scenario: When the JMO indicator has passed through the lowest horizontal line (the alert line) towards zero then passes back through the second lowest horizontal line (the trigger line) Like so:
When this occurs a green arrow is placed under the candle on the chart. Like so:
3rd Sell Signal
Overbought Scenario: When the JMO indicator has passed through the highest horizontal line towards 100, then passes back through the second highest horizontal line. Like so:
3rd Sell Signal
Overbought Scenario: When the JMO indicator has passed through the highest horizontal line towards 100, then passes back through the second highest horizontal line. Like so:
When this occurs a red arrow is placed above the candle on the chart. Like so:
VOLUMES
4th Buy & Sell Signal:
When the previous one or more bars are equal to, or higher than, the horizontal line. Like so:
Note: Do not use the Volume bar which is in the process of being formed.
Trade Entry
Enter a buy or sell trade on the H1 or M15 charts when all the signals referenced above occur at the same time. However, these can be over ruled by price direction consideration.
Trade Exit
Trading against the trend
When trading a retracement against the trend, look to take only a small profit, e.g. a few pips or decide to breakeven if the price becomes sluggish.
Trading with the trend
When trading with the trend, look to take larger profits and be prepared to ride out smaller retracements. There is no hard or fast rule as to how many pips to take; it depends on the considerations listed below.
Things to consider
1. How volatile is the price? (use the DD_ELIMINATOR to see this)
a. Is it becoming wider with the channels lines starting to point away from each other? This means it’s getting more volatile and the price will move quickly in both directions.
b. Are the lines already wide apart? This means the volatility has been happening for a while and may be coming to an end or it may continue for a little while longer.
c. Are the lines becoming closer together? This means the price is becoming less volatile and less likely to move quickly in one direction.
d. Are they close together and running parallel to each other? This means there is low volatility and the price will not move very much in either direction. Time to exit the trade with whatever profit you have.
2. Is the price heading toward an S or R line? (use the BOA to see this)
a. If so, exit the trade before it reaches it.
3. Did the price break through an S or R level just before you entered your trade? (use the BOA to see this)
a. If so, then you can be confident that it should stay above this line for a buy trade as the R level should become an S level.
4. How close to an Overbought (OB) or Oversold (OS) area is the price? (use the JMO to see this)
a. If it has just come out of an OB area then there is a good chance it will continue to the OS area at the bottom of the JMO.
b. If it is halfway between OB and OS then you’ll need to check the other indicators mentioned above to see if there is a reason to stay in the trade.
c. If it is coming close to the OS area for a sell trade then you should consider exiting the trade.
5. Is there enough volume to keep the momentum of the trade (use the VOLUMES to see this)
Stop Loss
The setting of a Stop Loss outlined below is precautionary only. The system is designed so that you will not hit the Stop Loss levels mentioned below unless you do not adhere to the system.
The beauty of the Pip Magnet is that it enters a trade with the expectation that it will result in a profit without the need to let your account go into draw down waiting for the price to return to its entry point.
A trade will always start in a loss position due to the brokers spread. If the Take Profit considerations (listed above) are still in your favour you should be confident enough to stay in the trade; giving the price enough time to move into profit. However, if the indicators start moving against your position or if you see that you have entered incorrectly (i.e. miss read or missed out one of the key entry signals) you should consider exiting the trade at a loss.
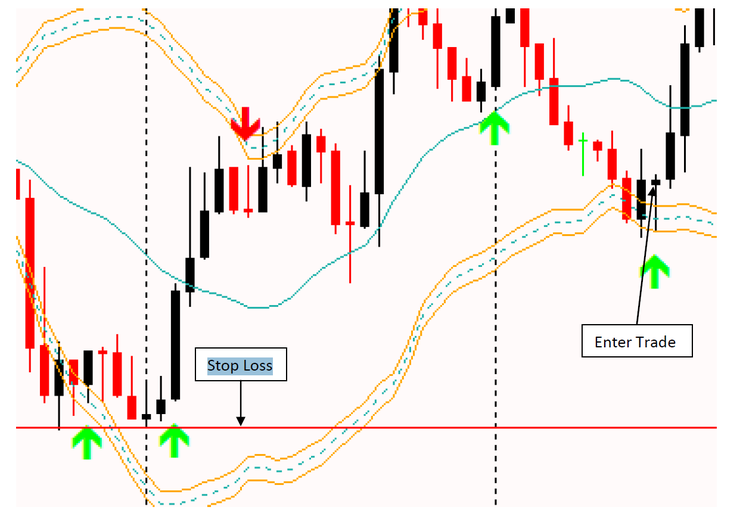
Buy Trade
Set your Stop Loss at the nearest swing low. Like so:
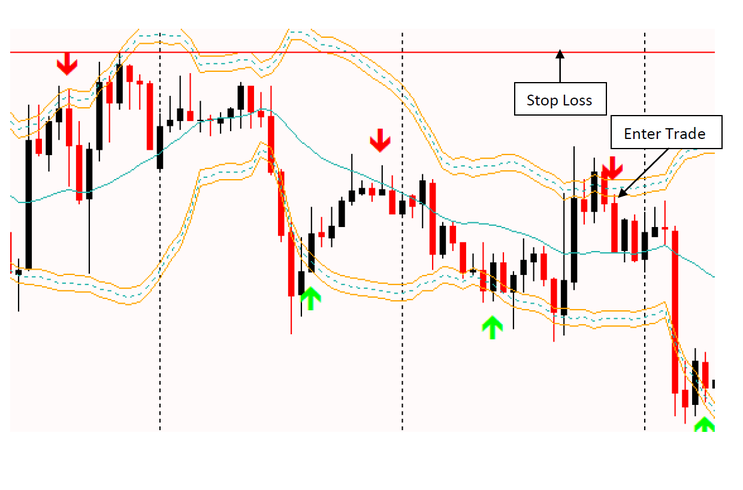
Sell Trade
Set your Stop Loss at the nearest swing high. Like so:

Norbert (Friday, 02 October 2020 11:36)
HI I have no arrow what should be the problem?
Edward (Thursday, 01 October 2020 20:05)
Thanks for the hardwork and effort in this site, really looking forward to the signals service.