


799# Price Position with TMA
Trading with TMA Bands and TDI
Accurate Trend Reversal Trading
Submit by Joy22
Price position with TMA bands is a trend reversal system based on overbought and oversold of the price defined by two slow TMA bands, with the same period but different ATR multiplier and an entry timing that depends by TDI (Dynamic Trader Index) and Cloud trend. It should be noted that the two TMA Bands that define the overbought and oversold areas of price recalculate slowly but the indicators that generate the entry timing do not recalculate. TDI is a very robust momentum indicator, well described on this site the TDI entry in the search box.
Time Frame 5 min or higher but recommendable 15 minutes or more.
Currency pairs: Major currency pair, lower stock Indices and Commodities.
Metatrader indicators setting:
TMA with distance half length 61, Atr multiplier 2.6, ATR period 100;
TMA with distance half length 61, Atr multiplier 3.8, ATR period 110;
Binary Viper ( length 100, pct filter 2.5); optional;
Cloud Trend (Ma 14, Bolliger bands 14 periods, deviation 2.0;
TDI default setting.
Trading rules Price position with TMA
Buy
When the price candle closes under the first TMA or both, wait until the TDI line is greater than the yellow line and that the Cloud trend indicator has a blue bar.
Place initial stop loss the TMA slow. Profit target ratio stop loss 1:1 1:12.
Sell
When the price candle closes above the first TMA or both, wait until the TDI line is lower than the yellow line and that the Cloud trend indicator has a red bar.
Place initial stop loss the TMA slow. Profit target ratio stop loss 1:1 1:12.
For a more aggressive approach you can enter the TDI intersection but it is advisable with time frame H! and H4.
This is a winnin strategy but requires training.
In the pictures Price Position with TMA in action.
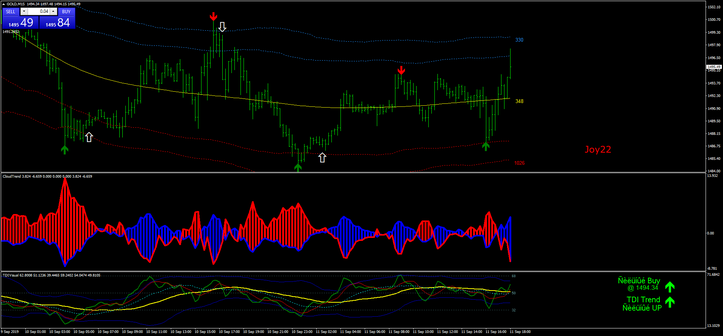
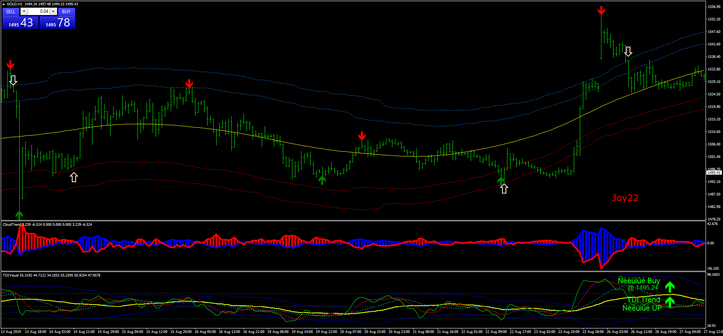
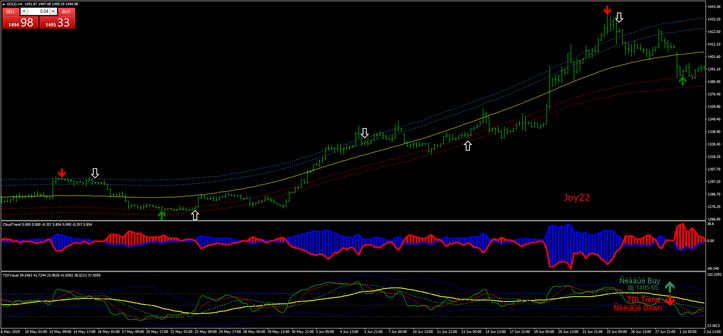
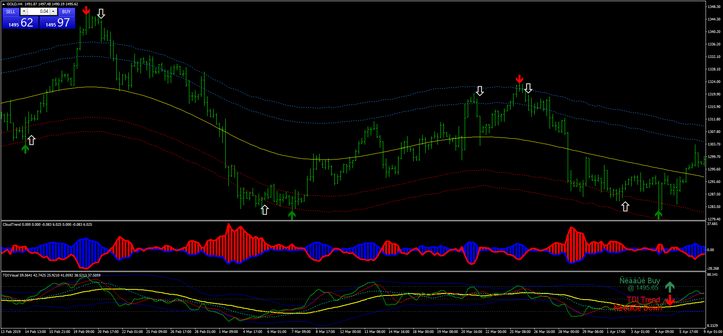
Share your opinion.
