


504# Traders Dynamic Index how to use
Traders Dynamic Index indicator Metatrader 5 and 4
Submit by Buddy 19/10/2013
This indicator Have Been written by Dean Malone.
The code of this indicator has been translated to many trading platforms as Tradestion, Nija Trader, FX Station, Metatrader 4 and Metatrader 5.
This is an indicator used by many forex traders because it is both an indicator of trend, momentum and can also be used as an indicator of inversion. Therefore, you can define the Traders Dynamic Index , due to its characteristics, a leading indicator.
This indicator uses some of the most powerful indicators such as the RSI as well as other types of calculations to determine the trend and momentum of the pairs. This indicator gives you the current situation of the pair you put it on and let you know whether we are in a bull or bear situation. Although this indicator can be used standalone, it is advised that you use other confirming indicators together with it. The Indicator Parameters are as follows:
Relative Strength Index (Period 13, close) — the period in bars for calculation of RSI indicator. RSI_
Volatility_Band (period, 34) . The lower this value is the curvier becomes the band.
Relative Strength Indexprice Line (period 2) — the period of the first moving average (fast).
Relative Strength Index PriceType (default = MODE SMA) — the type of the first ma.
Trade_Signal Line (period 7) — the period of the second ma (slow).
Trade_Signal Type (default = MODE SMA) — the type of the second moving average.
Use Alerts (default = false) — if true then sound alert will be played each time red and yellow lines cross.
When to Go Long You can open a BUY position when the following happens: 1. Green line is above red line 2. Both Green and Red line are above Yellow line 3. Yellow line is above 50 (Optional for long term/Must for short-term)
When to go Short You can open a SELL position when the following happens: 1. Red line is above Green line 2. Both Red and Green lines are below Yellow line.
3. Yellow line is below 50 (Optional for long term/Must for short-term) When NOT to enter a trade 1. Do not enter a trade when the Green/Red lines are outside the Blue Line or very near to it... try to enter the trades as close to the Yellow line as possible. 2. Do not enter trade when the Blue lines (bands) are too narrow as it shows little volatility in the market.
An In-Depth Guide to the TDI Pro
Joy22 2026
In the fast-paced world of trading, clarity is your greatest asset. While most traders clutter their screens with five different indicators to track trend, momentum, and volatility, professional traders look for tools that do it all in one glance.
Enter the TDI Pro RealTime (Traders Dynamic Index). This isn't just another RSI variant; it’s a comprehensive market sentiment engine designed to give you a definitive edge.
What is the TDI Pro RealTime?
The TDI Pro is an advanced technical indicator that blends the Relative Strength Index (RSI) with volatility bands and dual signal lines. By looking at price action through the lens of volatility and momentum simultaneously, it filters out the "noise" that often leads to false entries.
The Anatomy of the Indicator
To trade it effectively, you need to understand its four moving parts:
-
RSI Price Line (Green): Your fast-acting momentum tracker.
-
Trade Signal Line (Red): The slower, "confirmation" line that keeps you steady.
-
Volatility Bands (Blue/Outer): These expand and contract based on market activity.
-
Market Base Line (Yellow): The "spine" of the indicator that identifies the overall trend.
How the Magic Happens: The Math
The TDI Pro isn't based on guesswork; it’s built on statistical foundations. It takes a standard 10-period RSI and wraps it in volatility bands using a 1.6185 multiplier (the Golden Ratio).
This specific calculation makes the bands hyper-responsive to shifts in market energy. When you combine this with dual-smoothed signal lines, you get a "triple-filtered" view of the market:
-
Smoothing 1: Reduces erratic spikes.
-
Smoothing 2: Provides a clear crossover signal.
-
Volatility Overlay: Tells you if the move has actual "legs" or is just a flicker.
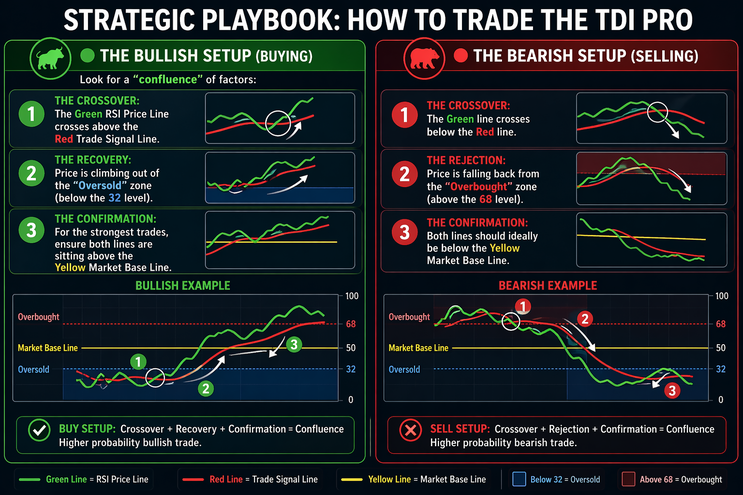
Strategic Playbook: How to Trade the TDI Pro
🟢 The Bullish Setup (Buying)
Look for a "confluence" of factors:
-
The Crossover: The Green RSI Price Line crosses above the Red Trade Signal Line.
-
The Recovery: Price is climbing out of the "Oversold" zone (below the 32 level).
-
The Confirmation: For the strongest trades, ensure both lines are sitting above the Yellow Market Base Line.
🔴 The Bearish Setup (Selling)
-
The Crossover: The Green line crosses below the Red line.
-
The Rejection: Price is falling back from the "Overbought" zone (above the 68 level).
-
The Confirmation: Both lines should ideally be below the Yellow Market Base Line.
Adaptability: One Tool, Many Styles
Whether you’re in and out in minutes or holding for weeks, the TDI Pro adjusts to you:
-
Scalpers (1m - 5m): Focus on the green/red crossovers for quick "scalps" while using the bands as dynamic support and resistance.
-
Swing Traders (Hourly - Daily): Watch for divergences—where price makes a new high but the TDI RSI line does not. This is a powerful "early warning" of a trend reversal.
-
Position Traders: Use the Market Base Line on high timeframes to stay on the right side of the long-term trend.
Pro Tips for Optimization
While the default settings are robust, you can tweak the TDI Pro to fit your personality:
-
Want faster signals? Drop the RSI Period to 8.
-
Want more reliability? Increase the Trade Signal Line to 10.
-
The "Sweet Spot": Most pros stick to the 13-period Volatility Band for a perfect balance between speed and accuracy.
The Bottom Line
The TDI Pro RealTime transforms your charts from a chaotic mess of lines into a clear roadmap. By combining momentum, volatility, and trend into a single window, it allows you to stop over-analyzing and start executing.
Ready to level up your charts? Integrate the TDI Pro into your routine and start trading with the confidence of a pro.
Traders Dynamic Index Indicator metarader 4 and 5
Traders Dynamic Index Indicator metarader 4.
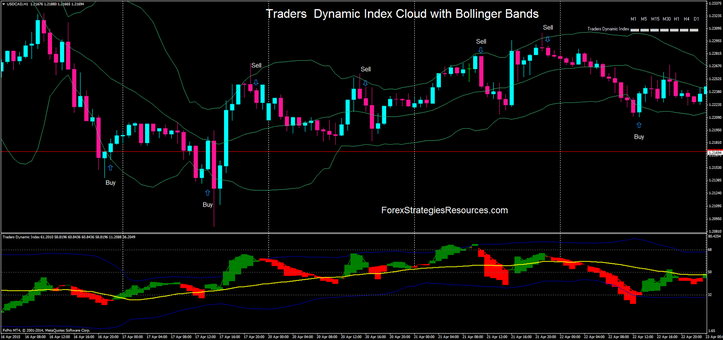
Trader Dynamic Index cloud
TDI Dashboard MQ4
TDI Dashboard signals for trading
TDI Dashboard is a complete system that generates trading signals made up of Heiken Hashi, TDI, Heiken Ashi with 5 EMA. The signals that this system generates are quite accurate.
Position output:
Initial stop loss on the previous swing high / low. Profit Target ratio minimum loss loss 1: 1.

TDI PRO MQ4
TDI PRO with Divergence and Overbougth or Oversold


Jalel hmani (Sunday, 28 January 2024 11:48)
Thing-you for alls freinds
kenney (Wednesday, 14 April 2021 21:19)
i can not download help
Tavares (Saturday, 25 July 2020 18:09)
Do you have the source code of the TDI pro indicator?
woze (Monday, 24 October 2016 23:35)
My hat off to Mr Malone! "Study" this indicator carefully, especially the code
joe (Monday, 27 April 2015 06:18)
is this profitable?
what is the winrate ratio?
Admin (Thursday, 02 April 2015 18:16)
yes
Justin Chung (Wednesday, 01 April 2015 08:23)
Hi. Is this work on indices?
Helmut (Monday, 21 October 2013 11:20)
Ok Admin , thanks for kind reply.
Forextradingstrategiesresources (Sunday, 20 October 2013 12:49)
This indicator is designed to work even on time frame of 5 min.
I think the best time is: H1 and H4.
thanks
admin
Helmut (Saturday, 19 October 2013 19:24)
Hi Buddy , thanks for explanation.
A question: what's the best TimeFrame ?
This indicator can be used also in M5 ?
Thanks for replay.