


4# AI Double Entry Indicator: A Simplified Dual-Strategy Approach -TradingView
Emiliano Quantitative Trader 2026
AI Double Entry script stands out as a particularly comprehensive toolkit. However, using all of its built-in features at once creates a chaotic and unreadable chart. This post explores a streamlined, highly effective approach using only two core functionalities visible in our setup charts: automated trendline breakouts and algorithmic buy and sell signals.
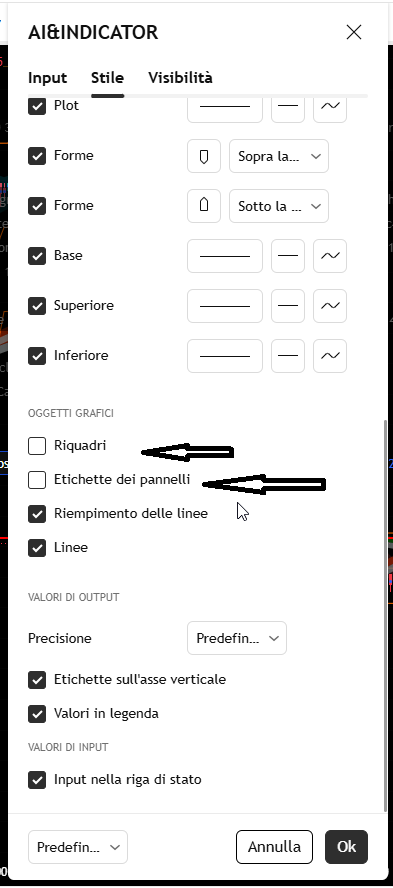
To achieve the clean and actionable chart layout shown in the examples, you must first heavily customize the indicator settings. Because this script includes volume profiles, divergences, Fibonacci retracements, and supply and demand zones, your very first step is to go into the settings menu and uncheck these extra features. By disabling the visual clutter of the volume histograms, divergence lines, auto-fibonacci levels, and zone boxes, you isolate the two most powerful price-action tools within the code. This creates a minimalist environment where you can focus purely on market structure and momentum shifts without being distracted by overlapping data.
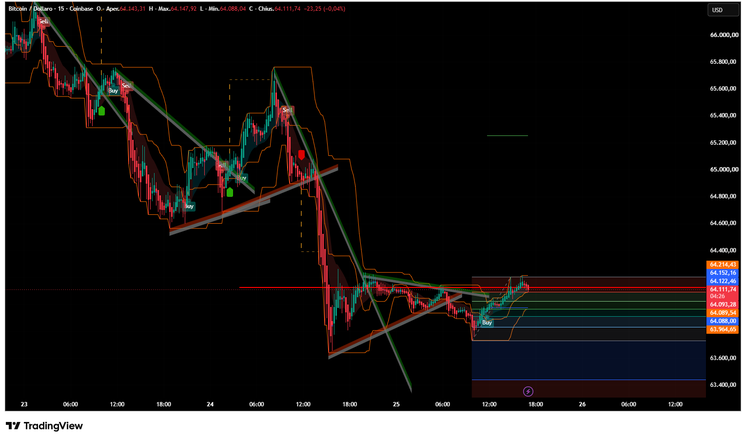
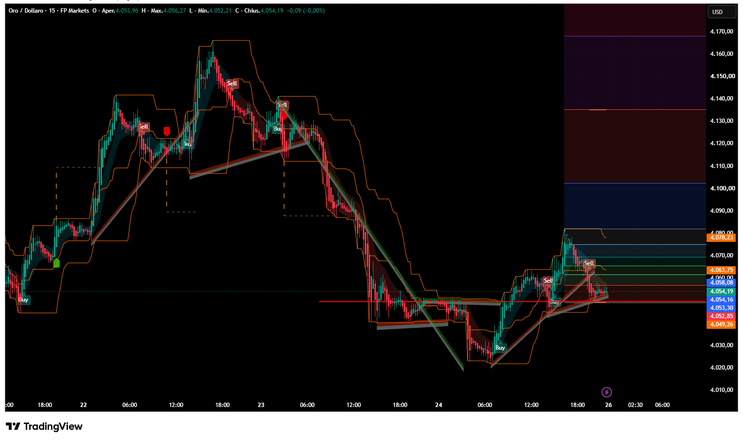
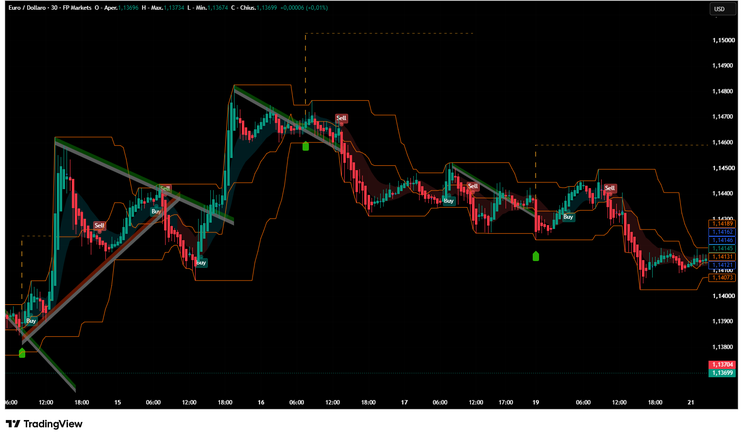
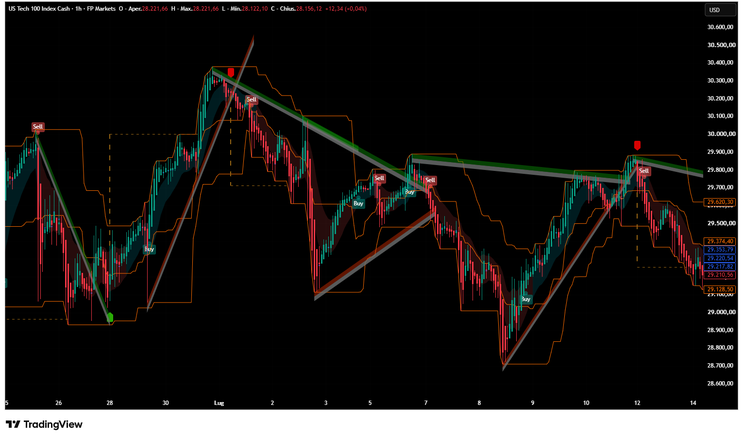
The first entry mechanism relies on the automated trendline drawing feature. The indicator identifies pivot highs and lows to construct dynamic support and resistance channels, often forming wedges, triangles, or compressed channels. In the provided charts, you will notice thick grey and green lines with shaded areas that visually compress the price action. The strategy here is to wait for a decisive candle close outside of these compressed trendlines. When the price breaks through the upper boundary of a descending wedge or the lower boundary of an ascending wedge, it signals a potential volatility expansion. Traders can enter a position in the direction of the breakout, using the trendline structure as a visual guide for market indecision resolving into a clear directional move.
Looking at the EUR/USD 30-minute chart, you can see how the trendlines effectively capture the ranging market structure with multiple tests of the channel boundaries before the eventual breakdown. The US Tech 100 Index demonstrates the same principle on a higher timeframe, where the descending trendline acted as dynamic resistance for several days before the bearish breakout occurred.
The second entry mechanism is generated by the trend continuation signals, which produce the distinct Buy and Sell labels on the chart. These arrows are calculated using a combination of Hull Moving Averages, Chande Momentum Oscillator, and Average True Range to identify shifts in market momentum. When a Buy signal appears, it indicates that the internal momentum has shifted bullish, often accompanied by a suggested entry price, stop loss, and multiple take-profit targets. Conversely, a Sell signal marks a bearish momentum shift. These signals are particularly useful for catching the meat of a trending move after a period of consolidation, providing clear, objective triggers that remove emotional guesswork from the execution phase.
On the Gold chart, notice how the Buy signals appeared right at the bottom of the sharp decline, marking the exact reversal point where momentum shifted from bearish to bullish. The subsequent Sell signals then captured the failed rally attempts, demonstrating how the indicator adapts to changing market conditions in real-time.
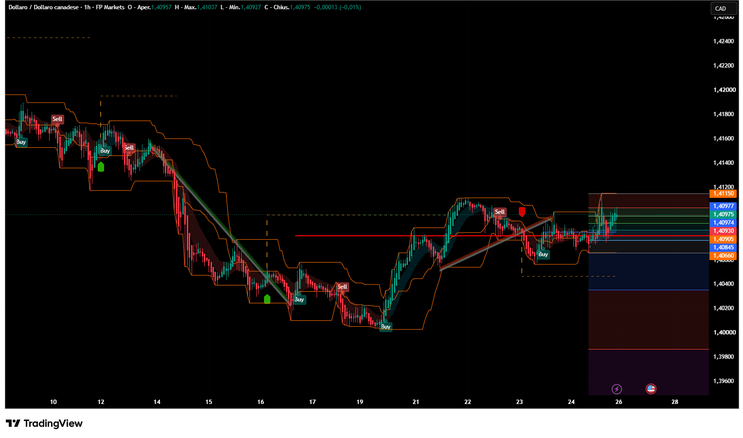
The USD/CAD hourly chart showcases the indicator's effectiveness in a consolidation phase, where multiple Buy and Sell signals helped traders navigate the sideways action while waiting for a clear directional bias to emerge.
The true power of this setup emerges when you combine both entry types to form a high-probability confluence strategy. Instead of taking every signal in isolation, you look for scenarios where the algorithmic Buy or Sell arrows align perfectly with a trendline breakout. For example, if the price has been compressing inside a descending wedge and suddenly breaks out to the upside, a simultaneous Buy signal from the momentum algorithm provides a strong confirmation of the move. This dual-entry approach filters out false breakouts and weak momentum shifts, ensuring that you only commit capital when both structural price action and internal momentum agree on the direction.
The Bitcoin chart perfectly illustrates this confluence in action, where the Buy signal coincided with the breakout above the descending trendline, leading to a strong upward move. By stripping away the unnecessary noise of the full script and focusing solely on these two complementary tools, traders can build a robust, repeatable, and visually clean trading system that works across different timeframes and asset classes, from forex pairs to indices, commodities, and cryptocurrencies.

4# Cross Ema Trading System
CHART SETUP:
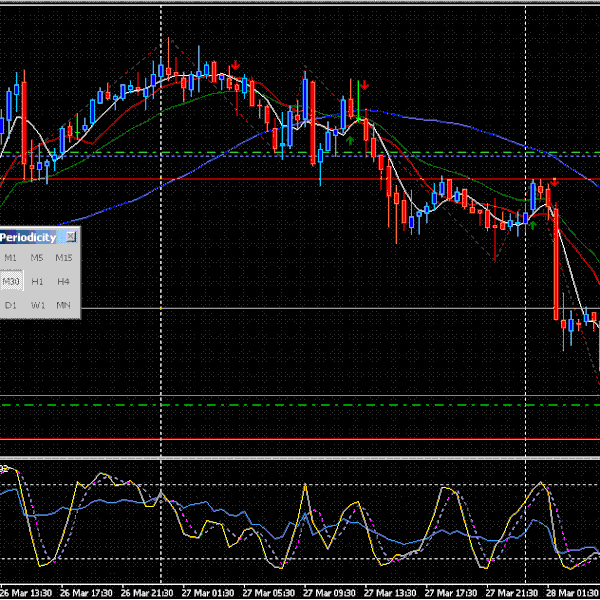
EMA: 5(White), 10, 20, 50
RSI: 14
Stochastics 5, 3, 3
Zig Zag: 12, 5, 3
EMA/EMA Cross Indicator
LONG:
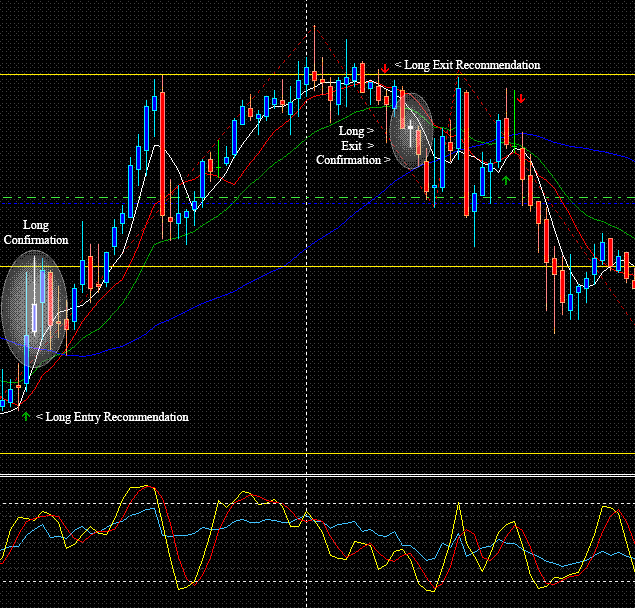
2.a Our entry is defined by:
- A Green arrow signaling an EMA cross /Entry Recommendation/
- A Whole candle closes above the 5 EMA (White) /Entry Confirmation/
2.b Our exit is defined by:
- A Red arrow signaling an EMA cross /Exit Recommendation/
- A Whole candle closes below 20 EMA (Green) /Exit Confirmation/
SHORT:
3.a Our entry is defined by:
- A Red arrow signaling an EMA cross /Entry Recommendation/
- A Whole candle closes below 5 EMA (White) /Entry Confirmation/
3.b Our exit is defined by:
- A Green arrow signaling an EMA cross /Exit Recommendation/
- A Whole candle closes above 20 EMA (Green) /Exit Confirmation/

-
#1
Hi. I need a trade alert indicator for this strategy. the alert indicator should send a push notification directly to my phone whenever a trade recommendation arrow appears. Thanks in advance.
EMA Forex Strategies
25# EMA's Band Scalp - Forex Strategies - Forex Resources -
4# Cross EMA - Forex Strategies - Forex Resources - Forex
84# 5 EMA and 13 EMA Fibonacci Numbers - Forex Strategies ...
40# MACD, RSI, 50 Ema and Pivot Points - Forex Strategies -
35# 100 EMA MultitimeFrame - Forex Strategies - Forex Resources
Ema Metatrader Indicator - Forex Strategies - Forex Resources ...
69# ADX, Parabolic Sar and three EMA - Forex Strategies - Forex
12# Ema, stochasticand RSI - Forex Strategies - Forex Resources
50# Williams % R , Stochastic and EMA - Forex Strategies - Forex
155# EMA CROSS RSI with Digital MACD - Forex Strategies -
72# EMA's, RSI and Stochastic - Forex Strategies - Forex
65# 100 'EMA and MACD “4H Strategy” - Forex Strategies - Forex
76# EMA's Retracement - Forex Strategies - Forex Resources ...
15# Ema Bands - Forex Strategies - Forex Resources - Forex ...
108# EMA's and RSI - Forex Strategies - Forex Resources - Forex
32# 4 EMA and Channel - Forex Strategies - Forex Resources ...
85# Ema's with Trading Range - Forex Strategies - Forex
126# 200 EMA Forex Strategy – - Forex Strategies - Forex ...
9# 6-12 EMA's - Forex Strategies - Forex Resources - Forex
96# EMA Cross - Forex Strategies - Forex Resources - Forex ...
6# Two Ema and MACD - Forex Strategies - Forex Resources ...
70# 3EMA'S - Forex Strategies - Forex Resources - Forex Trading
322# Channel 50 EMA two methods - Forex Strategies - Forex ...
83# 3 EMA's Forex Trading System - Forex Strategies - Forex ...
