


608# TW System
Mike Trader 05/12/2014
TW System trend momentum strategy based on t3 and Snake indicators.
TW System H4 Trading
This system I designed does not have a pdf manual. You have to understand a couple of basic forex knowledge for setups with resistance/support followed by news in conjunction of my template and change your mindset to play defense in order to beat the insiders, market makers, big capital institutions with their daily agendas. I have attached a chart to show what I see trading this system. I hope this helps explain a lot when trading on the 4HR timeframe.
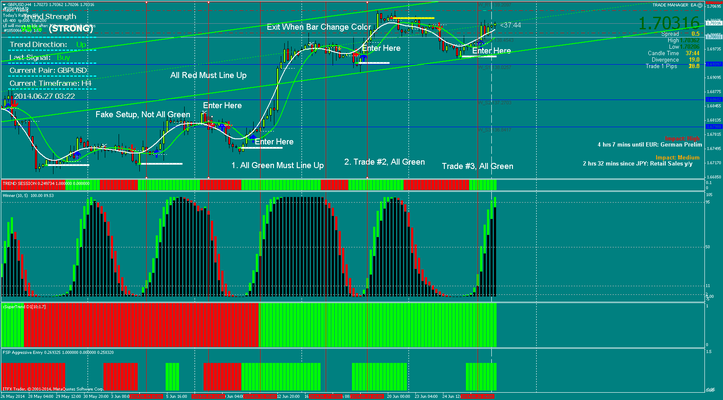
1. Wait for support/resistance to match the all three bars of same color
2. Measure the distance from the Snake and T3 lines for 9 pips or more for distance. If less don't trade, it's a fake....
3. Wait until the first set of bars close then trade the next set.
This system picks up a lot of the Europe Trading Session setups very accurately. You just need to make sure the distance or gap between Snake and T3 lines are 9 pips or more. This tells me the Big Players are going to push the market in that direction when all the other indicators line up.
I manage my trades depending on which pair I trade. For example, if I trade any JPY pairs, I am setting my breakeven after 20 pips profit. All USD pairs, I am setting breakeven after 12 pips. Most of the USD pairs range in 25 to 50 pip range (without news) so I target 25 pips. Most JPY range to 50 and 100 pips so I target 50 pips (without news). So with major news, I add 25 more pips to all pairs to be safe.
The Asian takes time to learn as they manipulate the currency during low volume. I would trade the Europe Session starting out with this system. During Asian session, you have to scalp if no big news is pending release. So, I usually wait until breakeven they evaluate the price movement then get out with 10 -15 pips on all pairs.
Someone asked how to re-enter on long/short trend.....You have to examine a couple of things. First, is there a catalyst to drive the price in that direction for a second time. Example, first news of CPI at 9 am then, second, Interest Rate at 4pm. The second news catalyst normally drives the price in that direction. I will sometime use the stochastic to check the cycle of the market. It tells a picture when using with TW 7 system. Sometimes, the market uses the stochastic when TW 7 shows a different setup on H1 timeframe. Sometimes the stochastic is playing right along with TW 7 system. You have to look at the cycles over two or three days to tell which days the system is working or it's scalp time.
First, I looked on the economic calendar to see if there's red impact news for GBP and the answer is no. But, there was news for the EU (Consumer Price Index) which means GBP will have an impact as well but not much. Therefore, I left my target at 50 pips because I know I can hit the target with ease. However, if GBP had major news like Interest Rate Decision then I would have increase to 100 or 150 pips as target price. Also, I try to think like a hedge fund manager; trying to find a way to push a lot of money around without being notice and they use major news to achieve their agenda. I don't care about having a lot of signals only the accurate signals since I care about winning and not a whole lot of scalp trading. When I trade, I trade big lot sizes so winning and risk free trades are the name of my strategy.
I just have one more hint to give...On your AFL Winner indicator properties settings. You right click the indicator on your chart and add the following on your Level tab. Add different lines for 95, 50, 11, and 2. This will draw the lines for the indicator. If you look at my charts then you know what I’m talking about. What this means: When the momentum bar hits 11 line to 95 line (starting from 2 line) ---the market players are done pushing the price higher. When you see the momentum drop below 95 line and all red bars are present with resistance bar, get ready to short until the momentum drops below 11 line touching the 2 line. Then you will see the momentum bar rise again from 2 line to 11 line then I look to see if the other indicator are green with support bar then it's time to long the pair. If all not green then it's normally a secondary drop. Sometime the momentum can reach the 50 line to fake traders then turn red a few bar later then you can enter an additional short if everything is red. In essence, you want to catch the first direction change because they are normally the easier trader to make pips. I hope this helps you.
When the FSP is blank and all is red then short. What this means --You are beating the rest of the market before it takes a serious drop and vice versa for going long a pair. Now, when FSP display first then the other indicators, those are normally your best trades because the market is pushing the pair before the insiders.
I would hold the trade if no major news is pending release in 4 -8 hours to give it time to develop. Most of the trades I enter take 4 to 16 hours to develop unless my stoploss, breakeven, or target price is hit. Just be patient and let the trade develop. That's why I like the 4HR timeframe, very little change to the indicators unlike the 15-30 minute timeframes due to whipsaws causing the indicators to change so much as well as emotions with the trader.
I normally don't trade on major holidays for US and Europe.
TW System H1 Trading
One, look at the 4HR, using this system, to determine the direction (up or down) then enter on the 1 HR in that direction when the setup occurs. You have to trade with the overall market direction and not take every setup that occurs. I think a lot of traders get caught taking every setup and don't look at the overall direction of the market. A little 30 second analysis could save you heartache and pain if you following the general direction of the market.
One of the most important thing, in my opinion, trading Forex and understanding the psychology of Market Makers. They look for big news to push their agenda. With AUDCAD, there was big news pending and I happened to scan the 4HR timeframe with the system and noticed the insiders were quietly dropping the pair. I looked on the 1HR for the setup for the drop and I was able to, at least breakeven, until I hit my TP or get close. In all, look at the economic calendar first and find all the red font news scheduled to announce then look at the 4HR to see if the insiders already pushing the price in that direction. Once you identified the direction, then you are able to make a trade on the 1HR timeframe.
Here's the website I use: http://www.fxstreet.com/economic-calendar/
The system is very profitable on the H1 during the London and U.S. sessions provided if you stick to the core rules I posted in previous postings. If you trying to trade the Asian session, I would recommend looking at the 4HR setup because everyone knows the low volume float can be manipulated by Market Makers overseas especially on JPY pairs. Also follow the economic news calendar prior trading... The divergence lets me know that block trades are coming and they can come fast or slow but in the direction I am trying to predict. I researched the divergence and realize a 9 or higher divergence can give better results than anything less.
Yes, it takes time to watch a lot of pairs. But with time, you will be able to scan the charts very quickly and setups on 4hr and 1hr simultaneously. For starters, I would narrow your watch list up 5 max pairs. Then get the hang of the system and become efficient with trend and cycle direction for each time frame. I use a very tight breakeven because I don't like losing hard fought pips to the Market. I rather breakeven and keep moving on to the next trade unless a re-entry setup becomes available then I take it...
I have the signals sent to my phone. Once I check the charts to confirm then the Trade Manager does the rest. I am okay if I breakeven or hit my TP as long as I don't lose on every trade. Like today, my EU long trade hit my breakeven then the price rose slightly then retraced to hit my breakeven. I didn't make any pips but I can live with the results.
Trade Manager
As far as the Trade Manager, here are the settings I like using (Setting Based on 5 Digit Account):
StopLoss.Pips: 400
TakeProfit.Pips: 500
Trail.Pips: 200
Trail.Starts.After.Breakeven: True
Move.To.Breakeven.at.pips: 200
Move.To.Breakeven.Lock.pips:0
The Move.To.Breakeven.Lock.pips means once the price moves in your favor by 200 (20) pips then the Trade Manager would move your stoploss from 400 (40) pips to the price you open the trade, in essence you’re breakeven. The trade is then risk free.
It took me years to really grasp how Forex is traded because I spent a lot of time trading stocks and that experience didn't translate into successful Forex Trader until years later. Then, TraderWill gave me information that opened my blinders a different perspective with trading Forex then I just practice and practice until I was able to double a demo account. Once I took the initiative to make the system my own then I began using on live accounts and very successful. I now focus on one trading or two trading system I developed based on TraderWill core philosophy: Momentum drive price with news and price action..
Settings for Pairs to Trade

 Pair           xSuperTrend Setting             Timeframe

GBPUSD             D1                             H4

GBPJPY             D1                             H4

AUDUSD             H4                             H4

EURJPY             D1                             H4

EURCAD             H4                             H1

GBPCAD             D1                             H4

GBPAUD             D1                             H4

NZDUSD             D1                             D1

NZDJPY             H4 or D1                       H4 or D1

EURUSD             D1                             H4

EURAUD             H4                             H1
TraderWill Version 3 update
Submit by Barry Vincent
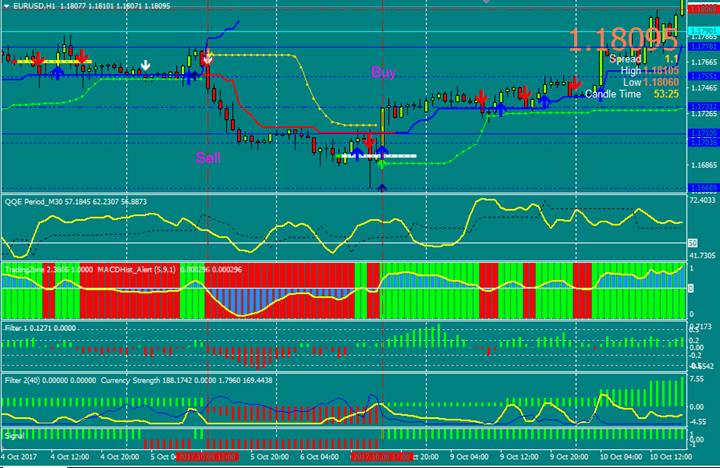
I only trade the EUR/USD.
I am not using any indicators for my exits.
I sometimes use support and resistance lines.
I sometimes use predetermined amount of pips.
The main indicators I use for my entries are the MACD and the QQE.
The other indicators are just for a heads up as to the direction.
The BBand can be used for extreme stop loss.
The currency strength indicator shows the strength of the Euro against the US Dollar.
When there are no clear signals for entry.
I use price action and go into scalp mod.
You will wait until filter 2 turns green.
The currency strength indicator is only for the euro/us.
The yellow line is the Euro dollar, the blue line is the US dollar.
The shi indicator repaints and is only to be used for a heads up to look for a signal in that direction.
Filter 1 will not repaint once the bar closes.

Write a comment
Ashraf (Sunday, 14 December 2014 07:52)
Thanks for sharing your strategy, can we use it to trade binary option?
Jeanne (Wednesday, 20 May 2015 16:36)
Thank you have been trading with the alfi indicator for a while this system is really good with alfi,if you have any updates please forward them lol
hassan shahzad (Thursday, 13 October 2016 18:09)
Great detail by Mike..hes a Real trader...
Youssef (Friday, 13 October 2017 19:33)
You know there are some repainting indicators involved yes? so watch out ok