729# RMO with Ichimoku
RMO trading
Submit by Simon 01/02/2017
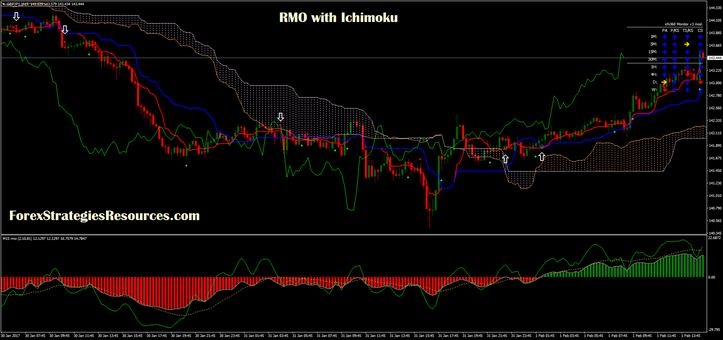
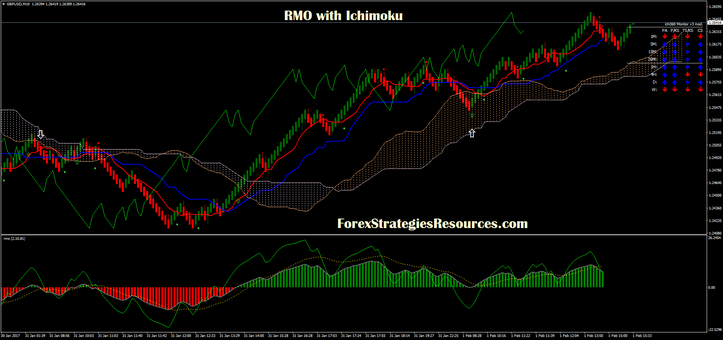
Rmo with Ichimoku is a trend- momentum strategy. Rmo is a Metastock indicator but here we have a modified version by Madlen with arrow. RMO indicator is a gauge to market direction. It is displayed as a histogram. As a bullish “buy” sign, we will look for the point at which the histogram shows movement crossing the oscillator’s zero line going upwards. If it should go down and cross the line going down, that would be our “sell” sign, or a “short-sell” sign.
RMO signals are filtered by Ichimoku cloud. This strategy is also good for trading with renko chart.
Time frame 15 min or higher.
Financial markets:any.
Renko chart 5 pips box size or higher.
Metatrader 4 indicators
Ichi 360 monitor,
Ichimoku alert,
rmo signals,
Renko live chart 600+.
RMO with Ichimoku trading rules
Find the trend
Buy
Ichi360 monitor with the blue arrows.
Example time frame 15 min Ichi blue arrows at the 5 min, 15 min, 30 min and 60 min.
Price above the cloud.
Rmo buy signals: you can use only the arrows or also the dots.
Sell
Ichi360 monitor with the red arrows.
Example time frame 15 min Ichi red arrows at the 5 min, 15 min, 30 min and 60 min.
Price below the cloud.
Rmo sell signals: you can use only the arrows or also the dots.
Exit is discretionary.
This strategy works fine on renko chart.
In pictures RMO with Ichimoku in action.