


624# Jim Berg Trading System for Metatrader 4
ATR Volatility Trading
Submit by Projectfx 09/02/2015
Jim Berg trading system for Metatrader 4. Jim Berger is a method for trading based on the Volatility and RSI. The source of this Method is Stock and Commodities Magazine “ The Trout About Volatility”. The purpose of Jim Berger is to answer these questions: Many indicators can help identify volatility. But can you use them to target specific price areas for entry signals, trailing stops, and profittaking opportunities?
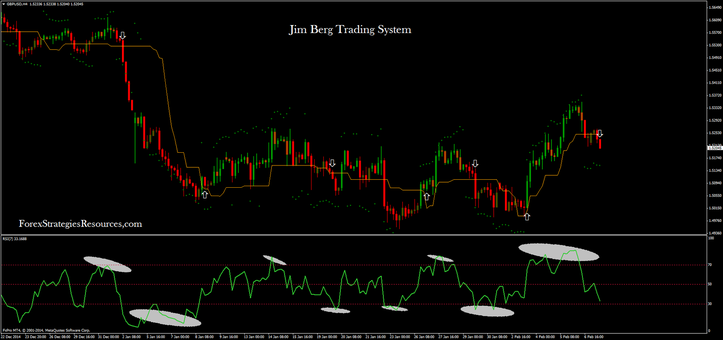
ENTERING TRADES Next, I bring up a daily chart and look for temporary oversold conditions in the rising security. To do this I apply the relative strength index (RSI), an oscillator I am sure you are familiar with. The RSI compares the average of rising price change to falling price changes. I use a seven-day time period, but you may choose to use a different one. You can see the RSI plotted in the lower chart in Figure 3. A security is considered to be potentially oversold when the RSI oscillator drops to 30. As you can see, this occurred on six occasions after the June weekly signal. It happened in July, September, and December 2003, and March, July, and October 2004. The oversold areas are circled. The addition of the RSI prepares me to purchase shares in BA once prices resume their rising movement. Since I am only going to enter the market after the RSI indicates that price has reached an oversold area, I will always miss the beginning of every move. My entry point occurs when the closing price has moved a distance that is equivalent to twice the average true range of the last 10 days from the recent low. I have programmed my software package to paint the bars blue once this criteria is met and red when the closing price has moved a distance equivalent to twice the ATR of the last 10 days from the recent high. Entry signal: If the close is greater than the lowest low value (based on the low of the last 20 days) plus twice the 10-day ATR, then enter a long position. C>(LLV(L,20) + 2*ATR(10)) Exit signal: If the close is less than the highest high value (based on the high of the last 20 days) minus twice the 10-day ATR, then exit your position. FIGURE 2: A SECURITY IN A RISING TREND. Price movement meets the criteria for a rising trend. FIGURE 3: USING ADDITIONAL INDICATORS.If you missed the first opportunity, have no fear. Using other indicators such as the RSI may help you enter at a later stage and still make successful trades. C<(HHV(H,20)-2*ATR(10))
In Figure 3, you see the RSI oversold areas and the corresponding blue bar volatility entry levels (arrows). I placed my initial stop just under the recent low, but once prices continued to rise, I applied a volatility trailing stop. After two consecutive closes below the trailing stop, I exited the position. I placed the stop at two times the ATR subtracted from the close. C–2*ATR(10) This indicator rises and falls with the level of volatility and higher or lower closing prices, and hence, I don’t want to lower the trailing stop. Instead, I adjust the formula to stay at the highest level reached for a period of 15 days or weeks, depending on which time frame I am using for the chart. HHV(C-2*ATR(10),15)
In Figure 4, you can see a weekly chart of BA showing the volatility trailing stop. Weekly exit signals were triggered in March and October 2004 on the second consecutive close below the volatility trailing stop. If you are a shorter-term trader, you may prefer applying the volatility trailing stop on a daily chart, just to get quicker exit signals (Figure 5).
In Figure 6, you see a daily chart of Boeing (BA) showing the trailing stop signals and the profit-taking opportunities. At point A, the RSI(7) reached oversold levels. A volatility entry signal occurred on March 29, 2004 (B). I would purchase shares at the open of the following day at $39.80. The initial stop is below the recent low at $37.97. A profit-taking opportunity occurs on June 16, when the closing price moves above the JB profit taker (C). As a result, I would close the position on the next day’s open at $49.58. Two consecutive closes below the volatility trailing stop signals an exit 13 days later at point (D). In this case, the two exit signals occurred at similar price levels. Keep in mind that the JB profit taker often signals exits after a sharp price rise before a correction, as shown
in Figure 7, the chart of United Auto Group (UAG). APPLYING VOLATILITY Identifying where to enter and exit a trade is an important component of a successful trading system, but developing a consistent trading system is often a struggle, especially for beginning traders. As we have all learned the hard way, choosing entry points, trailing stops, and profit-taking opportunities, all randomly based on opinion, is fraught with danger. You may believe you are applying common sense when trading what you feel, but as your emotions rise and fall, you will lose money. Fear, greed, and denial are not the investment tools you want to use in a disciplined investment strategy. Volatility entries and exits will indeed help maintain the discipline necessary to become a successful trader. You can set specific entries, trailing stops, and profit-taking opportunities.
Time Frame 4H or higher.
Currencu pairs: any.
Metatrader Indicators:
Jim Berger ATR 2.0
RSI 7 period.
Line Yellow trailing Stop line.
Profit Target: tips 1.5 ratio stop loss.
