


718# RSI Xard trading
RSI with moving averages
Submit by Maurice (author Xard777)
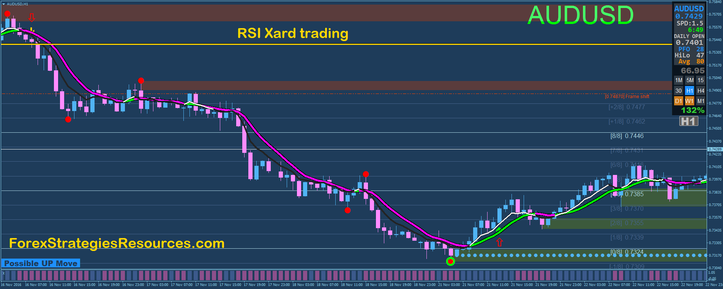
RSI Xard is a trading system based on RSI and Moving averages with interpretation of static support and resistance. This strategy is based on a solid idea of trading algoritmic. This is a trend- momentum strategy.
Time Frame 15 min or higher.
Financial market: any.
Metatrader Indicators:
MT4X TFX, pink and green lin,
RSI arrow,
MMAth, murrey math line,
II-Superdem identifies areas of support and resistance
Xardfx 21,
AARZZ support and resistance indicator,
Sema 4 NRP,
Ha SW alert
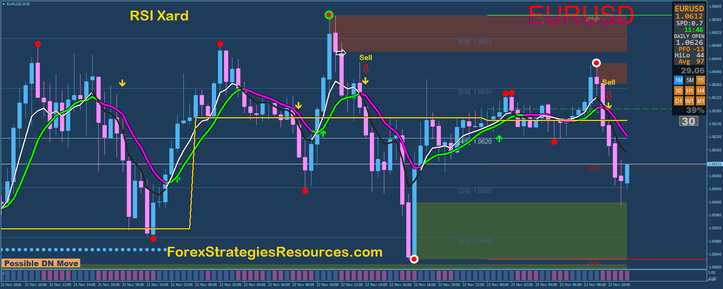
Trading Rules of RSI Xard trading
Sell
Price is near of the resistance area
Black line crosses below magenta line,
Yellow arrow sell
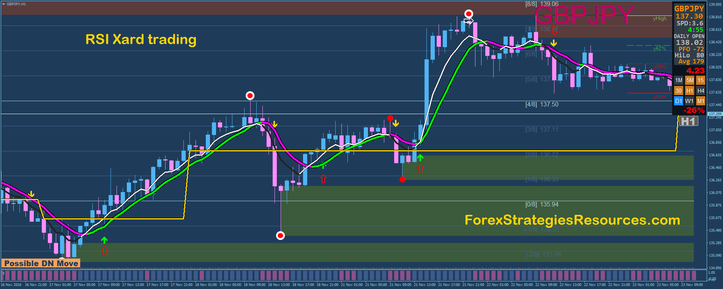
Buy
Price is near of the support area
white line crosses above green line,
green arrow buy.
Exit position options :
at opposite signal,
at the levels of murrey math line,
at the support or resistance area theses second and third options are recommended.
Place intial stop loss at the previous swing low/high.
"Intermediate and expert level because needs a preliminary analysis of the best areas of support and resistance, these are the key of success of this trading system."
In the pictures RSI Xard trading in action.

Sanjoe (Wednesday, 09 January 2019 20:02)
so far so good
mona (Sunday, 29 April 2018)
good-- i thanks for this system
claudio Alonso (Friday, 25 November 2016 05:19)
The semaphor indicator dont repaint beacouse apears 3 candles late.