


742# RSI with Trend Manager Strategy
Trend Manager Trading System
Submit by Marco 06/2017
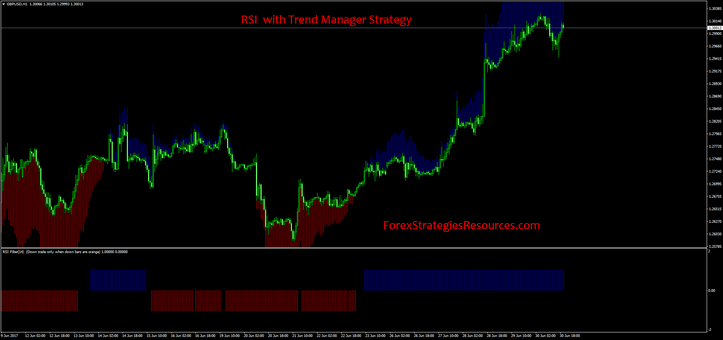
RSI with Trend Manager Strategy is a slow trend-momentum trading System.This system works best on 15M – 30M – 1H and 4H time frames. Any currency pair.
The rules are very easy and straight forward.
BUY SIGNAL:
BLUE LINES under the candles + BLUE BARS on the separated window indicator
Example
Once you see a blue line and a blue bar, that means the current trend is up trend. Open
“buy” order.
Stop loss can be a fixed number, for example : 50 pips for 1H time frame and 75 pips
for 4H chart.
Stop loss can also be based on support and resistance levels.
SELL SIGNAL:
RED LINES below the candles + RED BARS in the separated window indicator
Example
Targets can be based on :
1 – Fixed number for each trade. Example, 65 pips for 1H chart and 95 pips on 4H
chart.
2 – Opposite signal. Example, if the current opened trade is a sell trade then close it
when you get a buy signal.
3 – You can also use support and resistance, pivot points or Fibonacci levels.
Like any other trading system, this system is not the holy grail. That means you will
have losing trades!
There are many strategies to use to keep your account safe ..
1 – Use trailing ( moving ) stop loss
2 – Always use money management
For example, never trade with stop loss larger than your target. Never trade when
major economic news are released. Never trade with “scary/crazy” lot sizes!
This RSI with Trend Manager Strategy has an low profitability but ratio risk is high.

Write a comment
Moodather Osman (Monday, 20 May 2019 22:42)
god