


723# Fibo wave
MA Fibs, Elliott Wave
alienfx 13/12/2016
Fibo wave is an experimental template for study the relationship between static and dynamic support and resistance with the theory of the wave of Elliott. The idea is that support and resistence it can help to interpret the waves. This template is setting for intraday trading.
Why this is an experimental template? Because we have both static and dynamic support and resistance lines. This template is not for trading but only for observational study. The purpose is find if the wave work good with dynamic or static support/resistances lines.
The indicators used in this model are not random, but they have been carefully chosen so diligent and open source.
My working hypothesis is that dynamic indicators can better interpret the Elliott waves but have difficulties readapt, then, means to stabilize the support lines and dynamic resistance, I chose the envelpes based on fibonacci.
The observational study that I propose is to verify or deny the previous hypotheses through a discretionary study.
The benefits to be gained from this work is more efficient to use the wave theory.
The indicator of the waves, can also be replaced by another. On this site there is a large collection.
Time Frame 15 min, 30min 60 min.
Financial markets: any.
Metatrader Indicators:
MA Fibs high
MA Fibs low
Good trad
Swing ZZ,
Kbos
Pivot poins daily.
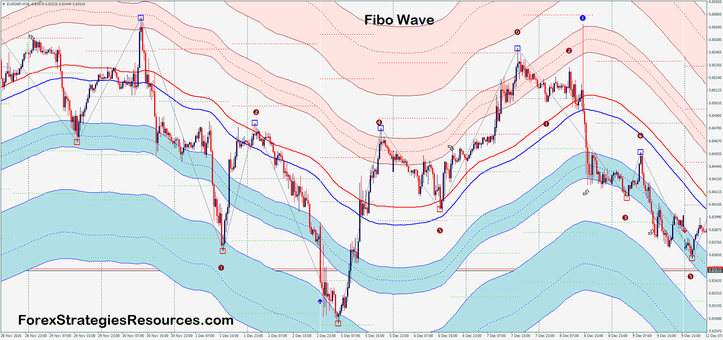
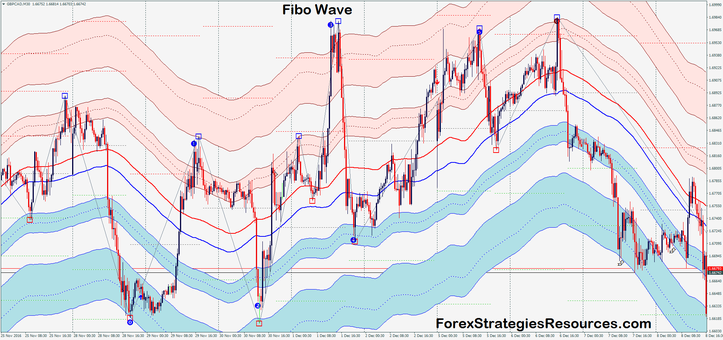
When appears the number of the wave (blue) wait that
the price action bounces on the supports/resistances dynamic or static.
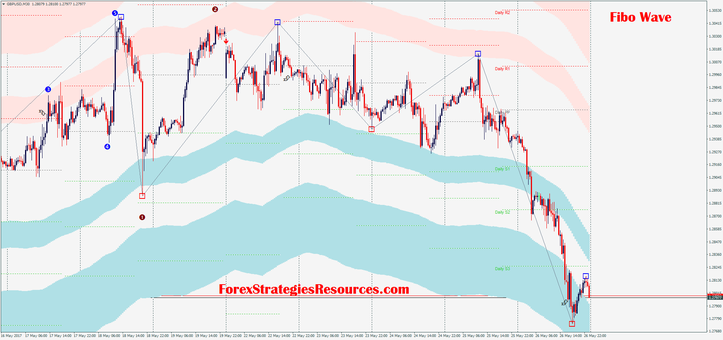
In the pictures Fibo wave in action.


Write a comment
Giovanni (Wednesday, 14 December 2016 00:25)
Very interesting proposal.
This template is a masterpiece.
Thank you.
Harry (Saturday, 24 December 2016 04:23)
hi there,
somehow template is not working and not loading...when i am inserting in to mt4 its is showing like ??kobos in template list and when loading the template, its keeping the blank just a plain candle stick template so can you reupload the template please?
thanks
George (Friday, 03 February 2017 14:19)
Simply amazing.
Thanks
Bob (Saturday, 27 May 2017 15:43)
when i am inserting in to mt4 its is showing like ??kobos in template list and when loading the template, its keeping the blank just a plain candle stick template so can you reupload the template please?
thanks
Admin (Sunday, 28 May 2017 20:34)
You have been so many to ask for the solution to this bug.
Bug in code was solved by Joy22,
thanks to Joy22!
Robert (Sunday, 28 May 2017 20:57)
Thanks, for the job.
The Fibowave template is fantastic.
I expect the Forex to open to test the template.
Bart (Monday, 29 May 2017 00:58)
How do you count Elliott waves? To me it looks like your indicator (see first chart: blue numbers) doesn't adjust to the lowest price and continue counting this as a '2'. If you look at the third chart (see blue numbers) everything seems to be okay till we get to 5. 5 should above 3.
I don't have a perfect understanding of Elliott waves, but certainly your numbers are rather swing points not entirely based on Fibonacci's. If somehow these floating bluish and pinkish zones would refer to Fibonacci's retracements/reversals that would be interesting. I like the idea of MA fibs low and high.
For me your trading concept seems to have more sense if you get rid of the numbers and zigzag indicator and keep pinkish bluish zones. Suggest trading short if the price bounces of pink zone or go long if the price reverses when bounces off blue zone. Obviously targets, risk and stops need working out.
Anyhow that's how I would use your system. Thanks for sharing alienfx.
zz (Wednesday, 28 February 2018 15:01)
greed is good
lets go
Ravi Kiran (Friday, 11 May 2018 17:28)
Has anyone followed the KBOS indicator? When you download the experimental template, the KBOS has an input of Weekly, I see that the indicator does not repaint. Proof, you can see like, as soon as the arrow appears, and the next high or low is formed, the arrow does not repaint !
But strange thing is it disappears and puts our state in great ambiguity !!!
Please advice
Regards,
Ravi