


648 KST Trading
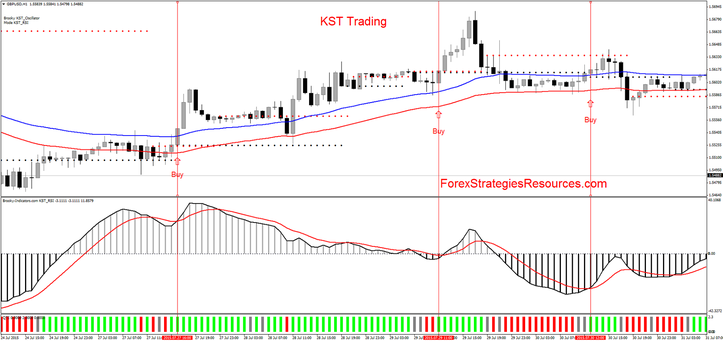
KST with rsi and moving averages channel
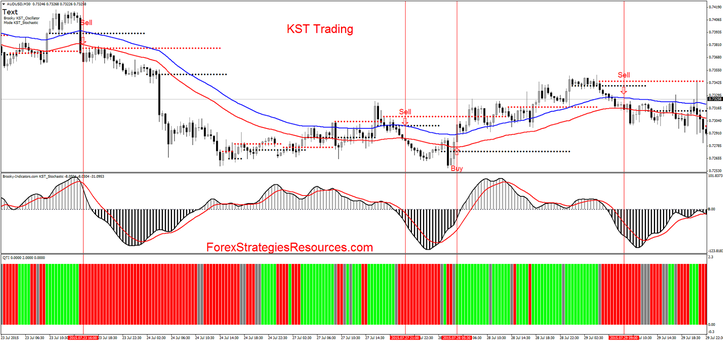
KST with Stochastic and moving averages channel
Submit by Penny 06/08/2015
KST Trading is a trend momentum system based on the KST indicator.
In show two setups KST with RSI and KST with Stochastic. The rules are the same.
Time Frame 30 min or higher.
Financial market: Indicies, Commodities and Forex.
Metatrader Indicators:
KST with stochastic( 14,5,3, 8),
KST with RSI (14),
QTI,
EMA 50 (high blue line),
EMA 50 (low , red line).
Rules KST Trading
Above EMA 50 blue line only buy.
Below Ema 50 red line only sell.
Buy
Price above EMA 50.
KST histogram crosses upward signal line.
QTI green bar.
Sell
Price above Below 50.
KST histogram crosses downward signal line.
QTI red bar.
Exit position
Make profit with ratio 1.3 stop loss or 1:1 depends by volatily of the market.
Stop loss below/above EMA's 50.
What 's the difference between KST with RSI and KST with Stochastic?
The KST with stocastic is more agressive.
In the pictures KST Trading in action.

Write a comment