


161# Trend Arrow Pivot Strategy
Janus Trader 2025
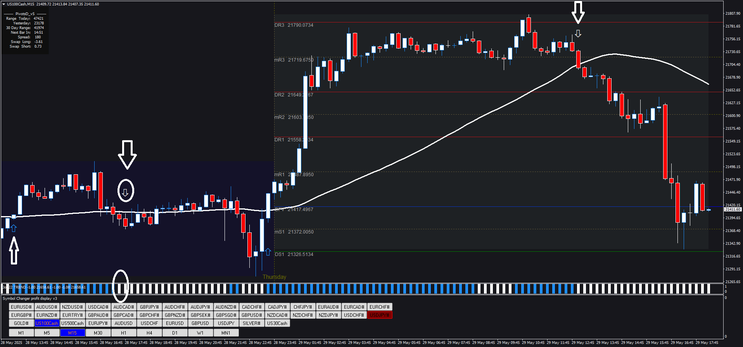
The Trend Arrow Pivot Strategy is a trend-following, short-term trading approach designed for use on the MetaTrader 4 (MT4) platform. This strategy focuses on aligning with the prevailing market trend, using a combination of moving averages, custom indicators, and pivot points to determine high-probability entry and exit points.
Setup
-
Time Frames: 5-minute, 15-minute, and 30-minute charts
-
Instruments: Major currency pairs, XAU/USD (Gold), US500, US100
-
Platform: MetaTrader 4 (MT4)
-
Indicators Used:
-
Simple Moving Average (SMA):
-
135-period SMA (Close) on 5-minute chart
-
50-period SMA (Close) on 15- and 30-minute charts
-
-
JoyTrend Indicator: Default settings
-
Arrow Indicator: For precise entry signals
-
Pivot Points: Used as profit target levels
-
Trading Rules
Trade only in the direction of the trend, as defined by the position of the price relative to the relevant moving average:
-
Buy Trades: Only if the price is above the applicable SMA
-
Sell Trades: Only if the price is below the applicable SMA
Buy Setup
-
Price is above the SMA.
-
A Buy Arrow appears (as per Arrow Indicator).
-
JoyTrend bar turns blue.
Sell Setup
-
Price is below the SMA.
-
A Sell Arrow appears.
-
JoyTrend bar turns white.
Exit Strategy
-
Exit at the nearest pivot point level.
-
Alternatively, use a fixed profit target with a risk-reward ratio of 1:1 to 1:1.2.
-
Set Stop Loss at the most recent swing high/low.
Conclusion
The Trend Arrow Pivot Strategy offers a structured approach to intraday trading by combining trend confirmation with momentum and support/resistance levels. By only trading in the direction of the established trend and using clearly defined entry/exit signals, the strategy aims to minimize risk and enhance the probability of success.
1Trading System, SEFC Palato Formula Universal
Submit Hang Jewan
LIST OF INDICATORS
1. SEFC01 : Daily Support Resistance
2. SEFC02 : Candle Remaining Time
3. SEFC03 : Price Monitor
4. SEFC04 : Smooth RSI
5. SEFC05 : Crossed Moving Average
6. SEFC06 : SEFC Backbone
7. SEFC07 : Long Trend Meter
8. SEFC08 : Bull Bear Meter
9. SEFC09 : Smooth Stochastic
10.SEFC10 : Dynamic Support Resistance
11.SEFC11 : Alligator
12.SEFC Bands1 : Inside Bands
13.SEFC Bands2 : Middle Bands
14.SEFC Bands3 : Outside Bands
15.Envelopes : Envelop Bands
MAIN FEATURES
• Multi Time Frame System, different Indicators System for different Time Frame
• Long Term Trend indicator on D1 Time Frame
RULES
Going LONG:
• SEFC05: Crossed Up, SEFC08: Blue Zone, SEFC06: Below candle
• Take consideration when price also on the Buying, Neutral or Selling Zone of SEFC01
• Very Strong signal when all indicators are united to long direction
Going SHORT:
• SEFC05: Crossed Down, SEFC08: Red Zone, SEFC06: Above Candle
• Take consideration when price also on the Selling, Neutral or Buying Zone of SEFC01
• Very Strong signal when all indicators are united to short direction
NOTES
Do not trade when SEFC05 crossed up but SEFC08 in Red Zone, and vice versa. Just wait for all indicators to agree on the direction of current market being formed.
Building your Money Management is a must! But being patience and discipline waiting for trading signal is the most important key of this system.
SEFC10 (Dynamic Support Resistance) is repaint, wait for 4 or 5 bars to be formed for powerfull valid signal.
Scissor will warn you about reversal correction pattern development (Huge profit taking for the market are being made).
The Overbought and Oversold area in lower indicator window can be used as a swing trading guide lines.
Use SEFC Bands to indicate rebound pattern. Watchout when price hits the SEFC Bands 2 or 3. It would be a great opportunity of profit taking when all indicators are agree with market direction.

-
#3
very nice system
-
#2
This system is difficult, if only because there is not a sufficent explanation of the multiple timeframes. The pics shown bear little ressemblance to the templates. There are differences as far as I can see between the daily, h4, h1 and 30m, but no explanation is obvious in the above instructions. There's little point using this strategy until clear full instructions are given or provided in a PDF.
-
#1
No es el que figura en la foto. es completamente diferente
295# SEFC Universal V.2 - Forex Strategies - Forex Resources ...
288# Fx Divergence - Forex Strategies - Forex Resources - Forex ...
204# US Oil System - Forex Strategies - Forex Resources - Forex ...
153# Dynamic Channel, Contrarian Strategy. - Forex Strategies ...
220# Trend System - Forex Strategies - Forex Resources - Forex ...
193# Trend Pullback System - Forex Strategies - Forex Resources
228# Great Trend - Forex Strategies - Forex Resources - Forex ...
256# Power Fuse - Forex Strategies - Forex Resources - Forex ...
