


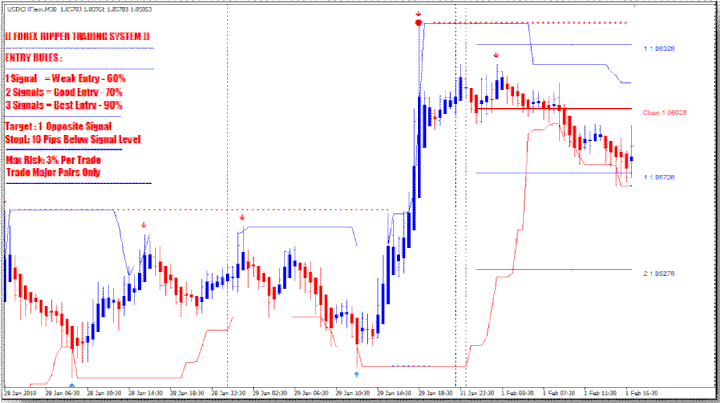
254# Forex Ripper Trading System
With this system we are going to use 6 indicators.
1 – Channel indicator
This indicators is channel made of two trend lines ( support – resistance ). We use this indicator to know when price reached oversold and overbought levels.
Blue line = Overbought = Best time to close any Buy orders = Not good time to open any new Buy orders.
Red line = Oversold = Best time to close any Sell orders = Not good time to open any new Sell orders.
2 – Heiken Ashi ( Blue bars – Red Bars )
This is a simple indicator to show us if the current wave is going up or down. It’s just
used for visual guidance and not going to be used in the system itself.
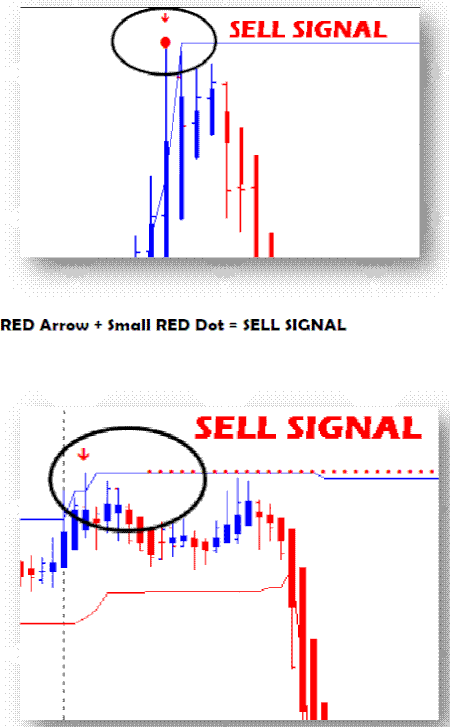
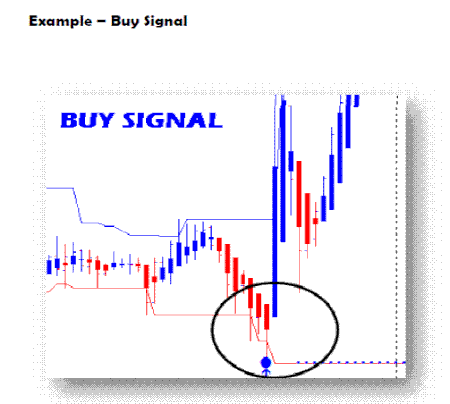
3 – Arrows
This indicator prints blue arrows for buy signals, and red arrows for sell signals. It’s
based on fractals and very powerful. But like any other indicator , it’s not perfect.
That’s why we are using other indicators to confirm the signals.
4 – Big dots ( trend reversals )
This indicator prints a big – blue or red dot – on top or below major support and
resistance levels. It’s based on zigzag calculations so expect to see it change its signals sometimes. Don’t ignore it just because it repaints. It’s still very powerful, especially on 1 H and higher time frames.
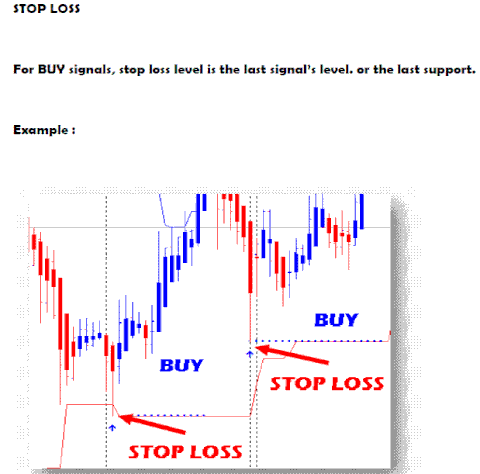
5 – Small dots ( S/R )
This indicator shows the major support and resistance levels. A new dot will be painted with every new candle going in the right direction. When this support or resistance isbroken ( price passed this level ) a new dot of the opposite color will appear.
Red dot = resistance
Blue dot = support
When price is testing a new support/resistance, the indicator will change its signal according to price movement. To make sure that the new support/resistance is
successfully formed, we are not going to use other indicators for confirmation.
6 – Target lines
This indicator shows horizontal lines across the chart. Each line is a good target/exit level. You can change the place of each line ( The distance of each line from the main muddle red line ) from the indicator’s settings.
SYSTEM RULES
First you must understand the main indicators of this system – the more powerful signal
– will come from 3 indicators.
1 – The arrows indicator ( fractals )
2 – The small dots indicator ( S/R )
3 – The big dots indicator ( trend reversals )
The golden rule here : Enter the market when you get at least 2 signals from 2
indicators. and exit the market when you get any ( one ) signal from any indicator of
the above indicators.
One signal from any indicator is not strong enough. You should have at least TWO
signals from 2 different indicators.
It doesn’t matter which indicators of the listed above. Any 2 of them is enough. But ..
the Arrows indicator MUST be one of them.
So, it could be – for example – Blue arrow + small blue dot. And it could be Blue arrow +
big blue dot.
The most powerful signal, is the one generated by all 3 indicators at the same time.
Arrow + Big dot + Small dot
This signal won’t happen every day. Maybe 3 or 4 times per week. But it’s very
powerful. And if you could wait for it and make this signal your main trading rule, then
do it. It’s worth waiting for!
But if you prefer daily trading, then you can safely trade by the 2 signals rule.
See examples trades
Forex Ripper Mual trading System
Share your opinion, can help everyone to understand the forex strategy.

Vinitrader (Wednesday, 10 October 2018 20:18)
Hi, I can't find the way to make HORIZONTAL LINES in this system. TARGET LINES INDICATOR shows vertical lines.
murthy (Saturday, 17 September 2016 17:23)
This indicator repaint or not?????
tushaoye (Monday, 16 May 2016 10:51)
why the arrow comeout so late after many candles ?